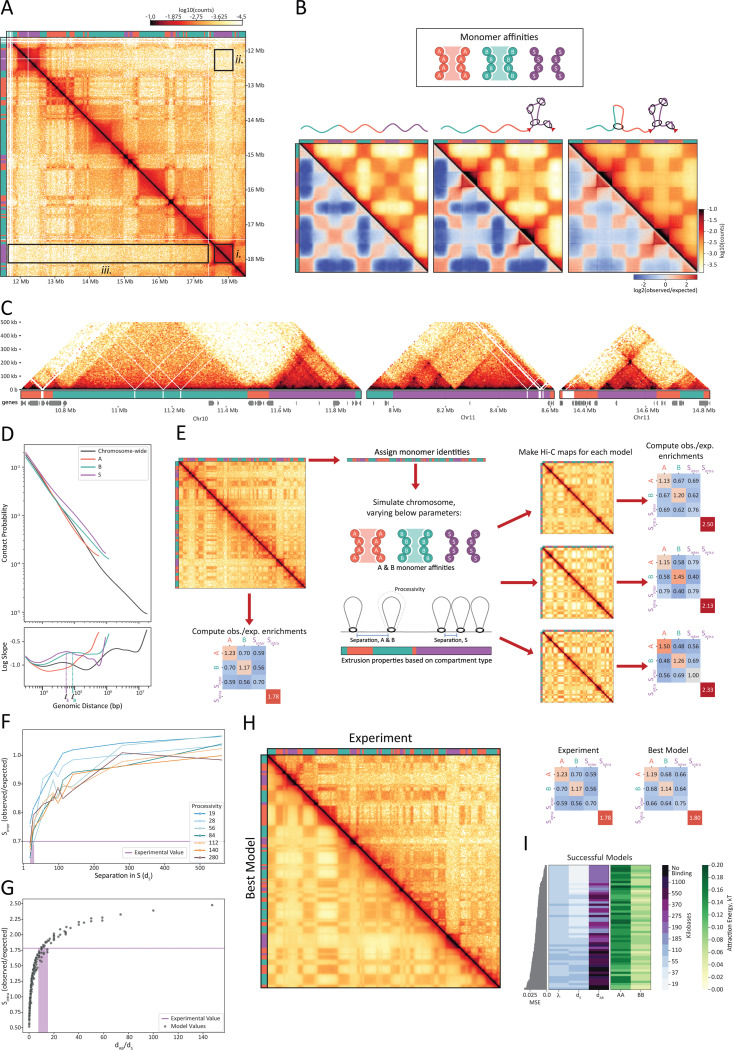
Figure 4: Simulations of affinity-based compartmentalization and activity-based loop extrusion recapitulate Hi-C contact patterns.
(A) Hi-C map and compartment annotations highlighting the three distinct features of S compartments. Data correspond to Chr22: 11,625,000–18,435,000 from PD-D2 sample. (B) Minimal models of A, B, and S compartmentalization with A-A and B-B affinities (both set to 0.075 kT) and S-S and heterotypic interactions set to 0.00 kT. In silico Hi-C and observed-over-expected Hi-C maps for models of (left) compartments only; (middle) compartments plus high extrusion S; (right) compartments plus high extrusion in S and low extrusion in A and B. (C) Evidence of loop extrusion in the PD-D2 Hi-C data including insulated domains, stripes, and corner peaks. Three regions of the PD-D2 Hi-C maps at 5 kb resolution, with compartment and gene tracks below. The regions correspond to (left) Chr10: 10,640,000–11,900,000; (middle) Chr11c: 7,900,000–8,615,000; (right) Chr11c: 14,310,000–14,820,000. (D) (Top) The contact probability P(s) curve for PD-D2 Hi-C as a function of genomic distance (s). (Bottom) Log-derivative of contact probability as a function of genomic distance. Curves represent averages of either chromosome-wide (gray) or for contiguous segments of a given compartment type (colored). Estimates of the average loop size in S (ℓS) and in B (ℓB) are noted along the x-axis. (E) General workflow for comparing the experimentally generated Hi-C to the polymer models of Chr15: 0–6,500,000. (F) Observed-over-expected values of S-Sinter plotted as a function of separation between loop extruders in S (dS) for a series of polymer models. Each curve represents a series of models, which share loop extruder processivity. All models lacked extrusion in A and B chromatin and shared homotypic attractions of 0.12, 0.04, and 0.00 kT for A, B, and S, respectively, to yield an A/B compartment strength similar to the experimentally generated Hi-C. The experimental value of S-Sinter is shown as a purple line. (G) Observed-over-expected values of Sintra plotted as a function of relative abundance of loop extruders (dAB/dS) for a series of polymer models, each with different processivities and separations. The experimental value of Sintra is shown as a purple line. (H) Best polymer model versus the experimental data for Chr15: 0–6,500,000. The best model’s parameters are A-A attraction energy = 0.16 kT, B-B attraction energy = 0.08 kT, S-S attraction energy = 0.00 kT, λ = 55 kb, dS = 19 kb, dAB = 190 kb. (Left) Experimentally generated Hi-C (top, right half of the map) versus the in silico generated Hi-C map from the best model (bottom, left half of the map). (Right) Summary statistics (observed-over-expected off-diagonal compartment and on diagonal Sintra enrichments) for the experimentally generated data (left) and best model (right). (I) Summary of successful polymer models. Parameter values for (center) extruder properties and (right) homotypic A-A and B-B affinities. Models were sorted by (left) the mean square error of their observed-over-expected summary statistics versus those of the experimental data (top-most parameter set corresponds to the best model visualized in Figure 4H).

