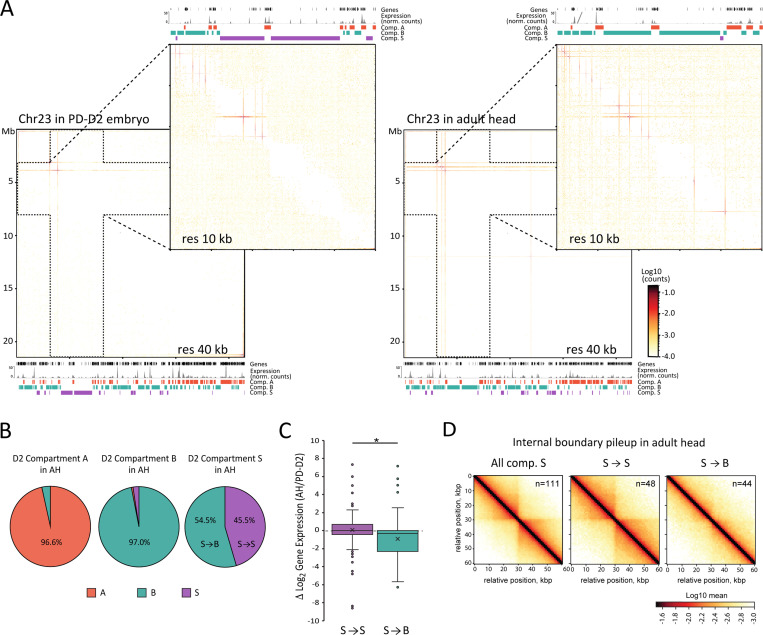
Figure 6: Compartment S changes during development.
(A) Hi-C contact maps of the full Chr23 at 40 kb resolution and Chr23:3,000,000–80,000,00 region at 10 kb resolution in PD-D2 embryos on the left and in adult head (AH) on the right. Below or above each matrix are gene locations, RNA-seq expression aggregated at 1 kb resolution and compartments A, B, and S genomic location, for the corresponding stage and region. (B) Compartment assignment in AH datasets of large domains (>200 kb) assigned to large compartment A, B or S in PD-D2, in % of the compartments assigned in PD-D2. (C) Box plots of distributions of log2 ratio of gene expression (TPM) between PD-D2 embryos and AH. In purple is the distribution for genes that are in domains assigned to compartment S in the two stages (S→S) (n=119), and in green is the distribution for genes that are in region assigned to compartment S in PD-D2 and that switched to B in AH (S→B) (n=120). Boxed region corresponds to data between first to third quartile. Line indicates median of distribution while cross corresponds to mean. Whiskers extend to lowest and highest data points, and dots outside correspond to outliers. Asterisks indicate distributions significantly different by Kolmogorov-Smirnov test (*: P-value = 0.01 – 0.05). (D) Pileup plots centered on internal boundaries within all large S compartment domains (>200 kb, excluding 40 kb on each side of domain boundaries) in AH or S→S and S→B categories, as described in the right panel of (B), at 5 kb resolution and extending to 30 kb on each side.

