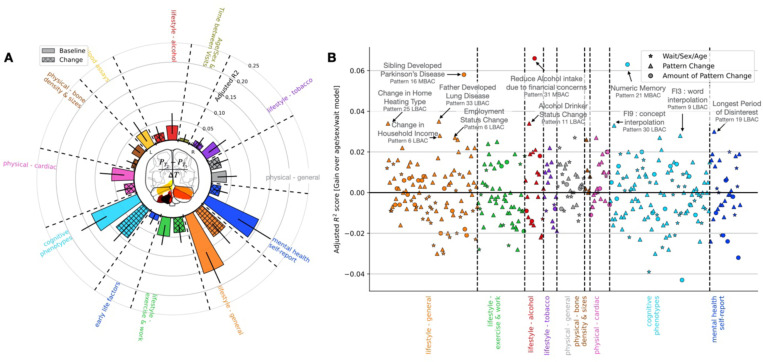
Figure 3: Changes in lifestyle and cognition reflect changes in structural brain asymmetry.
A (A) Specific behavioural domains capture longitudinal progression of brain asymmetry. Coefficient of determination (R2) of L2 penalized linear regression models predicting pattern 6 LBACs on the basis of behavioural phenotypes within a given domain. All models additionally contained sex, age at first imaging visit, and time between visits information. R2 scores were adjusted for number of parameters in the models. Phenotype changes represent the difference in response variables between the first and second imaging visits, and do not contain information about baseline response. Cerebellar contributions to pattern 6 are showcased in the centre of the graph. Ipsilateral cerebellar lobule VIIIa, 8b, 9 shifts alongside contralateral cerebellum crus I and II shifts characterize asymmetry pattern 6. (B) Whole-brain asymmetry pattern changes reflect changes in lifestyle and behaviour. Coefficient of determination (R2) gain derived from including LBAC and MBAC information in L2 penalized linear regression models predicting a behavioural phenotype on the basis of non-brain variables as well as brain asymmetry changes. Baseline comparison models contained only information about age, sex, and time between visits. R2 scores were adjusted for number of parameters in the models. A separate regression model was constructed for each phenotype. Shape of points represent the largest absolute coefficient contributing to the behavioural prediction, categorized according to membership to LBAC (triangle), MBAC (circle) or non-brain variables (age, sex, time between visits; star). Measures of socioeconomic status, including change in household income and employment status feature among phenotypic changes linked to structural brain asymmetry change.

