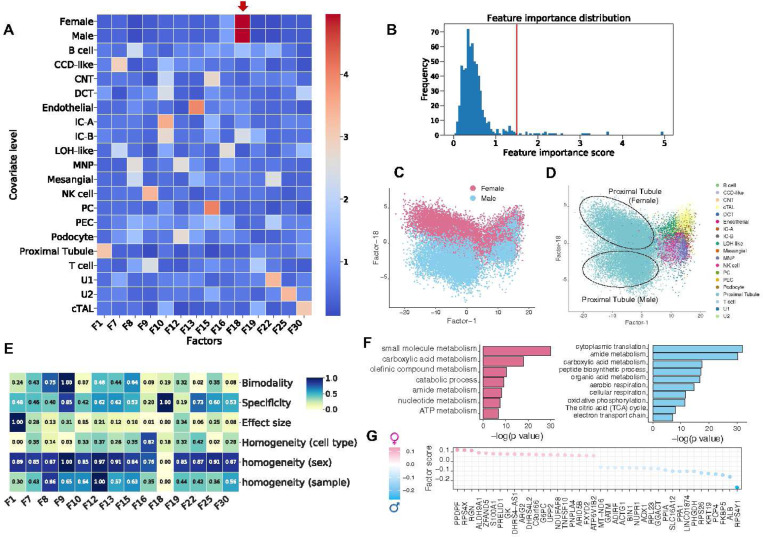
Figure 2). Deciphering cell type identity programs and sex-specific processes in a human healthy kidney map.
We applied sciRED to a single-cell healthy human kidney map obtained from 19 living donors, with similar contributions from both females and males. A) FCA heatmap with covariate levels as rows and associated factors as columns. Arrow highlights factor F18 which demonstrates a high association score with female and male covariates. B) FCA score distribution for all factors. The red line indicates the automatically defined threshold used to identify significant factor-covariate matches in the heatmap in A. C) FIS heatmap representing the interpretability scores of the selected factors. Distribution of cells over factor F1 and factor F18 colored based on D) sex and E) cell type covariates indicates the predominant representation of sex-related variation within the proximal tubule cell type. F) Pathway analysis results on the top positive (female) and negative (male) loaded genes of factor F18. G) Top 20 positively and negatively loaded genes of factor F18.

