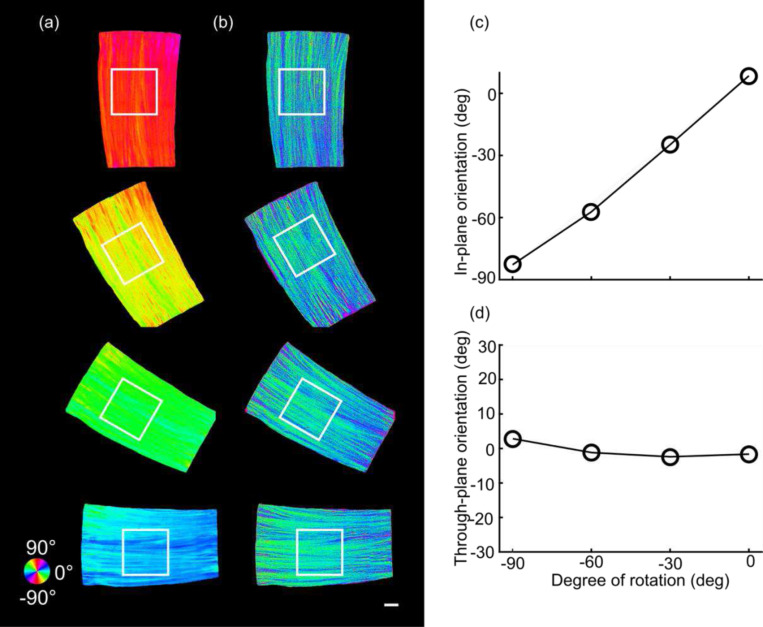
Fig. 4.
Characterization of through-plane orientation measurement at four different in-plane orientation angles on a corpus callosum sample. (a) The estimated in-plane orientation images at in-plane rotations of −90 deg, −60 deg, −30 deg, and 0 deg. (b) The corresponding through-plane orientation images. The black boxes indicate the ROIs to obtain the FODs. The angles of orientation in (a) and (b) are indicated by the color wheel. The average in-plane (c) and through-plane (d) orientation of the FODs within the ROIs shown in (a) and (b) with respect to the degree of rotation, separately. Scale bar: 1mm.

