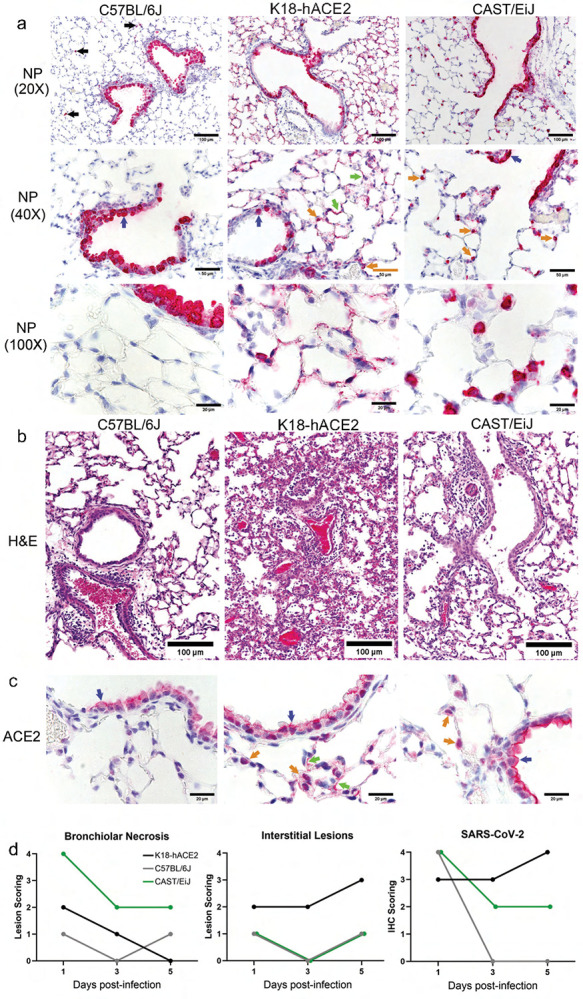
Figure 3. Histological and immunohistochemical analysis of SARS-CoV-2 infected lung tissues.

(a) a-NP antibody staining of lung sections was performed to identify infected cells (in red) in the lungs of each mouse strain at day 3 post-infection. Black arrows point to low frequency infected macrophages found in C57BL/6J mice. Blue arrows point to infected bronchiolar club cells. Green arrows point to infected AT1 cells and orange arrows point to infected probable AT2 cells. (b) Hemotoxin and eosin-stained lung sections from each infected mouse strain are shown. (c) ACE2 was also targeted for immunohistochemistry using a specific antibody. Blue, green, and orange arrows point to club, AT1, and probable AT2 cells, respectively, expressing ACE2. (d) Pathology scores for bronchiolar necrosis, interstitial lesions and SARS-CoV-2 staining. Scoring scale used was 0,1,2,3,4 (none, minimal, mild, moderate, severe). The data are representative of three experiments of similar design, where in 4 mice (2 male and 2 female) were used per time point.
