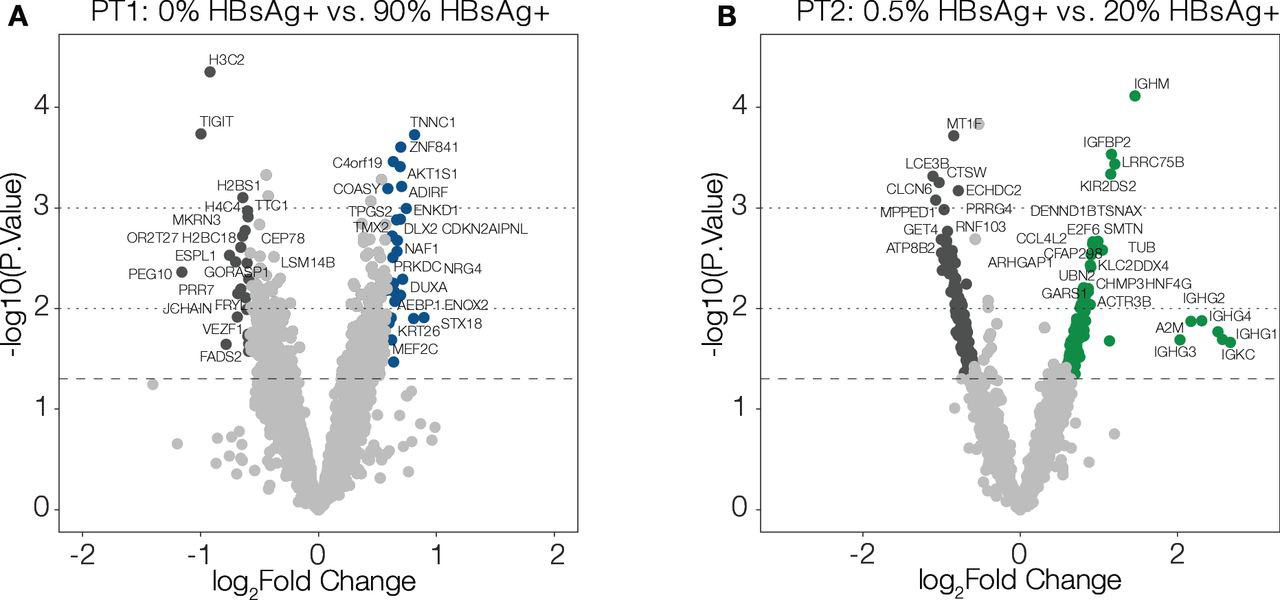
Figure 3.

Minimal transcriptional differences between high and low areas of HBV surface antigen (HBsAg) expression. The visual estimates of HBsAg+ cell positivity for each group of regions of interest are indicated above the differential gene expression of each patient biopsy: patient (PT)1 (A) and PT2 (B). Patient-relative areas of low and high HBsAg protein expression were compared. Unadjusted p values are shown; no p values were under 0.05 after adjustment for multiple comparisons. From top to bottom, the horizontal dashed lines show p=0.001, 0.01 and 0.05. HBV, hepatitis B virus.
