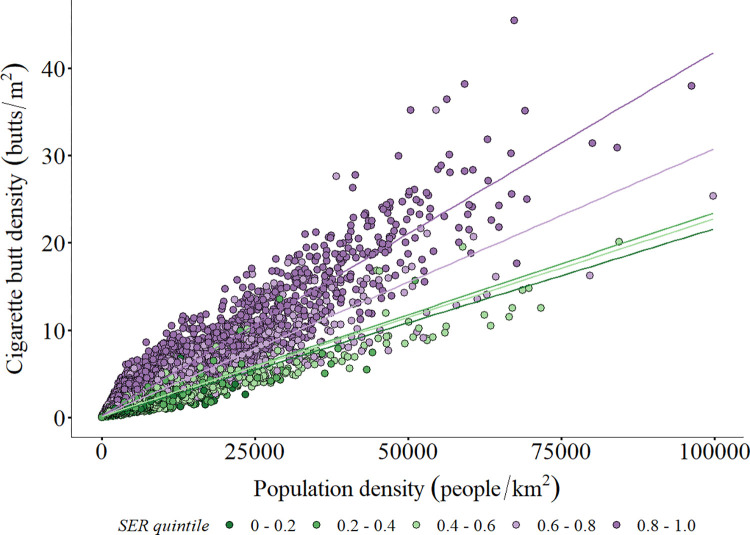
Fig 2. Comparison of cigarette butt density to population density (People/km2) among quintiles of Social-Environmental Risk.
Each point represents a census tract. Social-Environmental Risk represents the percentile rank (from 0 to 1) of all census tracts. Lines are linear regression for data within a quintile.

