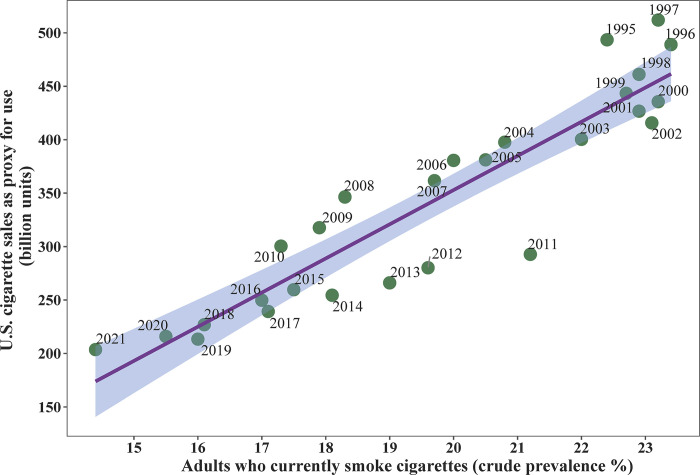
Fig 3. Relationship between cigarette sales in the U.S. as a proxy for use and percent of U.S. adults who currently smoke.
Predictions from a linear regression are plotted (dark line) with upper and lower 95% confidence intervals (shaded area). Points represent data from the CDC’s Behavioral Risk Factor Surveillance System survey for smoking prevalence and U.S. Alcohol and Tobacco Tax and Trade Bureau for cigarette sales for the year labeled in the plot.

