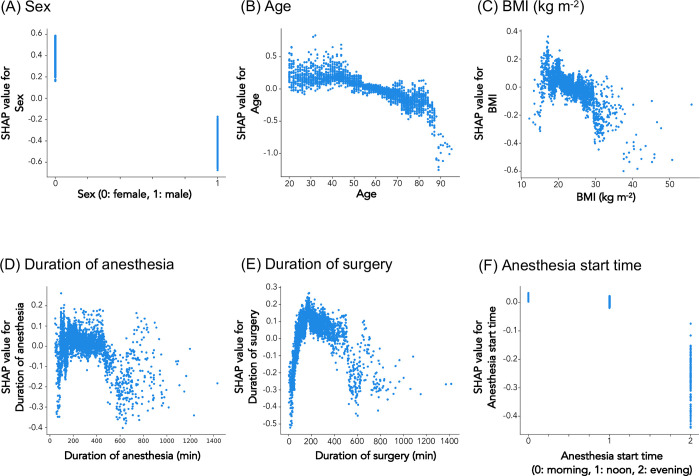
Fig 2. Relationship between patient-related and time-related risk factors and PONV in SHAP value.
The X-axis represents (A) sex (0: female, 1: male), (B) age, (C) BMI (kg m2–1), (D) duration of anesthesia (min), (E) duration of surgery (min), and (F) anesthesia start time [morning (8:30–12:00), noon (12:01–17:00, or evening (17:01–24:00)]. The Y-axis represents the risk of PONV. SHAP value above 0 is related to the risk of PONV.

