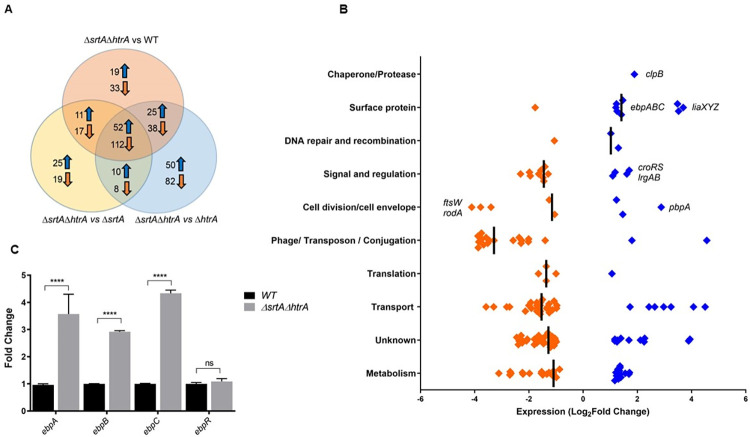
Fig 3.
Global transcriptional changes due to absence of htrA and srtA (A) Venn diagram showing a total of 164 genes found to be differentially regulated specifically during pili accumulation on the cell membrane (i.e. in the absence of both srtA and htrA). Genes that are only found in one or two of the indicated groups are in the non-overlapping regions. The total number of differentially expressed genes in each comparison is indicated inside each group. (B) The log2 fold change in mRNA levels of the core 164 genes that are differentially expressed in the ΔsrtAΔhtrA strain. Values displayed as a dot plot correspond to differences between ΔsrtAΔhtrA and ΔsrtA. Significant genes were determined by the Bioconductor package EdgeR (P < 0.05; FDR < 0.05). Genes with negative log2 fold change are colored orange; genes with positive log2 fold change are colored blue. Genes of interest were labeled for easier identification. (C) qRT-PCR analysis of ebpABCR expression in the WT (black bars) and ΔsrtAΔhtrA (grey bars). qRT-PCR was performed in biological triplicates and analyzed by the ΔΔCT method, using gyrB as a housekeeping gene. Fold change indicates the change in ebpA, ebpB, ebpC and ebpR transcription compared to WT. Statistical analysis was performed by 2-way ANOVA and Tukey’s multiple comparison tests using GraphPad. **** P ≤ 0.0001, P ≥ 0.05 differences not significant (ns).

