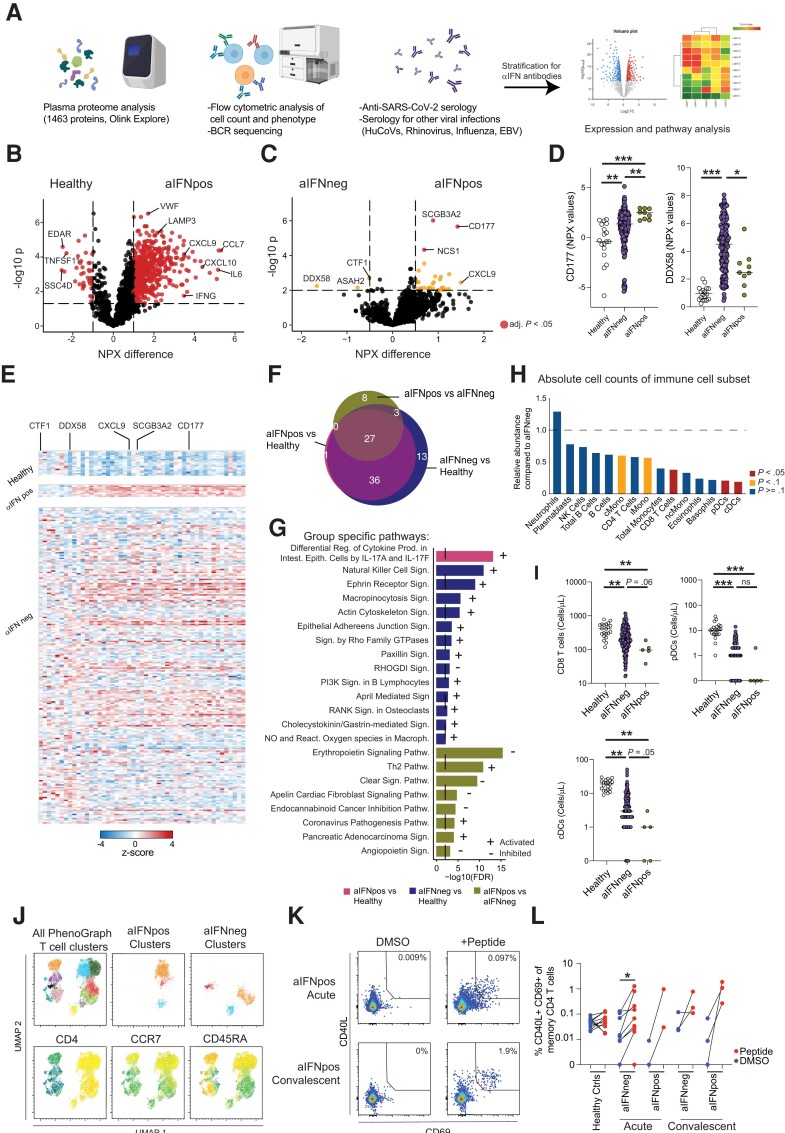
Figure 2.
Autoantibodies against type 1 IFN modulate the cellular immune compartment. A, Schematic of performed analysis. B and C, Volcano plot of soluble proteome (1463 proteins) analyzed with proximity extension analysis (OLINK Explore panel) of healthy controls (n = 18) or COVID-19 patients at the first time point of sampling during acute disease stratified for absence (n = 225, aIFNneg) or presence (n = 9, aIFNpos) of autoantibodies against IFN: (B) comparison of healthy controls and aIFNpos individuals; and (C) aIFNpos and aIFNneg patients. Samples were tested for significant differences with t test and false discovery rate-adjusted P values for multiple comparison, displayed are unadjusted P values in yellow for P<0.05 and in red adjusted P values <.05. D, Exemple plot displaying raw NPX values for CD177 and DDX58; differences among the groups were calculated with Kruskal-Wallis test followed by Dunn correction for multiple comparison. E, Heatmap displaying z scores of the differentially expressed genes between aIFNpos and aIFNneg patients, as in (C), for healthy controls, and aIFNpos and aIFNneg patients. F, Venn diagram displaying shared and distinct pathways calculated with the IPA for the different comparisons of the 3 groups. G, Overview of the specific IPA pathways in (F) for the indicated comparisons. H, Ratio of average absolute lymphocyte counts when comparing aIFNpos (n = 5) to aIFNneg (n = 174) patients in the acute phase of COVID-19. Groups were compared with Mann-Whitney test; blue P > = .1, yellow P < .1, red P < .05. I, Absolute counts of CD8 T cells, pDC, and cDC for healthy controls (n = 10), and aIFNneg (n = 174) and aIFNpos COVID-19 patients (n = 5). J, UMAP and PhenoGraph clustering analysis from flow cytometric phenotyping of T cells. Included were aIFNpos and aIFNneg donors (each n = 7) at first time point of sampling that were concatenated and split according to aIFN positivity after the respective analysis. To determine the most frequent clusters in aIFNneg and aIFNpos individuals the relative contribution to the cluster was calculated (see also Supplementary Figure 4). K and L, T-cell function in healthy controls (n = 11), and aIFNneg (n = 9) and aIFNpos patients (n = 5) upon DMSO or SARS-CoV-2 peptide stimulation. *P < .05, **P < .01, ***P < .001. Abbreviations: aIFNneg, IFN autoantibodies negative; aIFNpos, IFN autoantibodies positive; UMAP, uniform manifold approximation and projection; BCR, B cell receptor; cDC, conventional dendritic cells; COVID-19, coronavirus disease 2019; DMSO, dimethyl sulfoxide; EBV, Epstein-Barr virus; huCoV, human coronavirus; IFN, interferon; IPA, ingenuity pathway analysis; ns, not significant; pDC, plasmocytoid dendritic cells; SARS-CoV-2, severe acute respiratory syndrome coronavirus 2.

