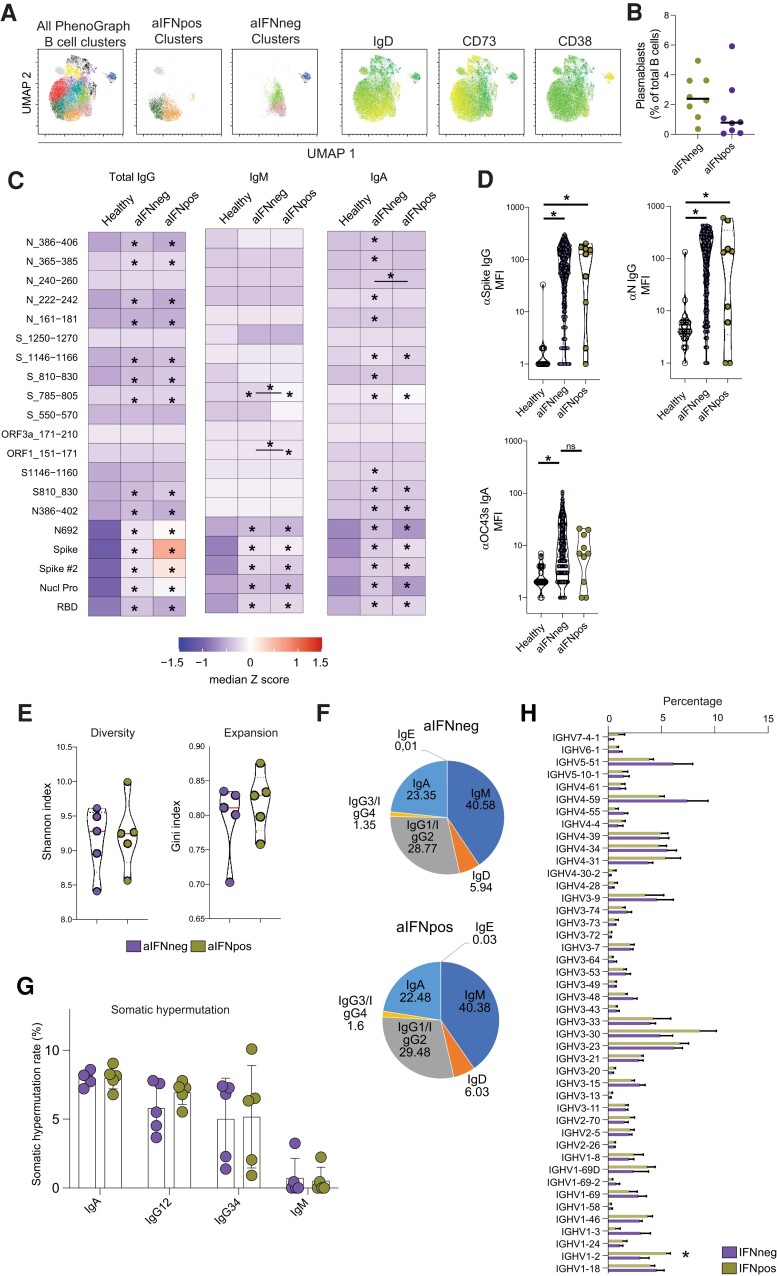
Figure 3.
Intact humoral immunity despite type I IFN autoantibodies. A and B, Flow cytometric analysis of the B-cell compartment. Displayed are UMAP and PhenoGraph analysis for the most enriched clusters (A, see also Supplementary Figure 4) as well as exemplary summary data (B) for aIFNpos and aIFNneg patients (each n = 8). C and D, Microsphere array-based analysis of antibodies specific against SARS-CoV-2 or other virus proteins or peptides. C, Levels of IgG, IgM, and IgA antibodies against the indicated SARS-CoV-2 peptides or full-length proteins. Displayed are median z-scores for healthy (n = 18), and aIFNneg (n = 225) and aIFNpos (n = 9) patients during acute stage of COVID-19. D, Exemple data of IgG antibody levels against SARS-CoV-2 and IgA response against spike protein from the seasonal cold coronavirus OC43 (n = 18 healthy, n = 241 aIFNneg, and n = 10 aIFNpos patients). E–H, Results from B-cell receptor sequencing from aIFNpos and matched aIFNneg patients during acute disease (each n = 5). Displayed are diversity and expansion indices (E), antibody isotype composition (F), somatic hypermutation rate (G), and IGHV preference (H). The median of somatic hypermutation rate and IGHV frequency were calculated for each sample. C and D, significant differences were tested with Kruskal-Wallis test followed by Dunn test for multiple comparisons. E–G, Differences were calculated by Mann-Whitney test. *P < .05. Abbreviations: aIFNneg, IFN autoantibodies negative; aIFNpos, IFN autoantibodies positive; UMAP, uniform manifold approximation and projection; COVID-19, coronavirus disease 2019; IFN, interferon; Ig, immunoglobulin; MFI, mean fluorescence intensity; ns, not significant; SARS-CoV-2, severe acute respiratory syndrome coronavirus 2.

