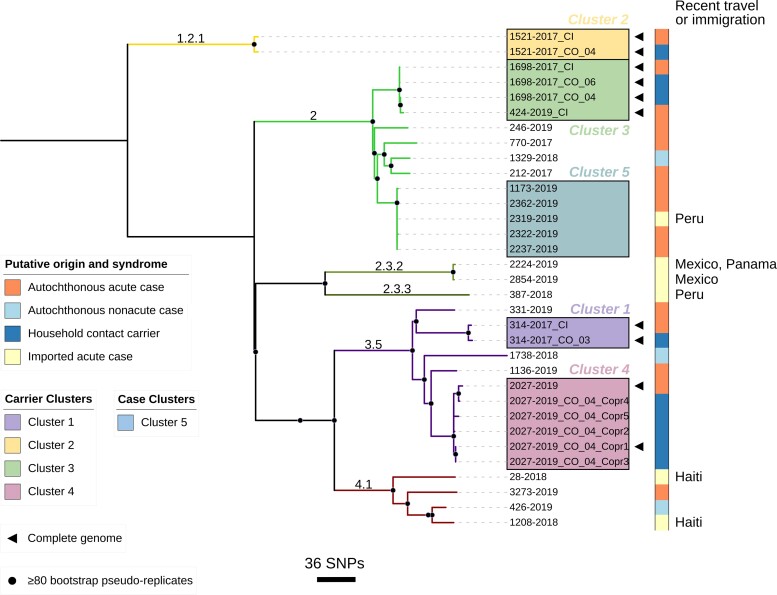
Figure 2.
Maximum likelihood tree depicting core genome phylogenetic relationships of Salmonella Typhi isolates in this study. Branches are both labeled and colored by GenoTyphi assigned genotypes. Putative geographic origin (autochthonous or imported, and travel/immigration-associated country if imported) and clinical syndrome (acute or nonacute case) are indicated by the color strip. Carrier clusters 1–4, each associated with a confirmed chronic carrier detected through household investigations, are distinguished by both colored boxes and adjacent labels. Completed genomes (assembled from Illumina and Oxford Nanopore reads) are identified by a black triangle. Bootstrap supported nodes are identified by black-shaded circles. The scale bar shows a measure of the number of single-nucleotide polymorphisms (SNPs) by branch length. Tree visualized using iTol v6.7.5 (https://itol.embl.de/).

