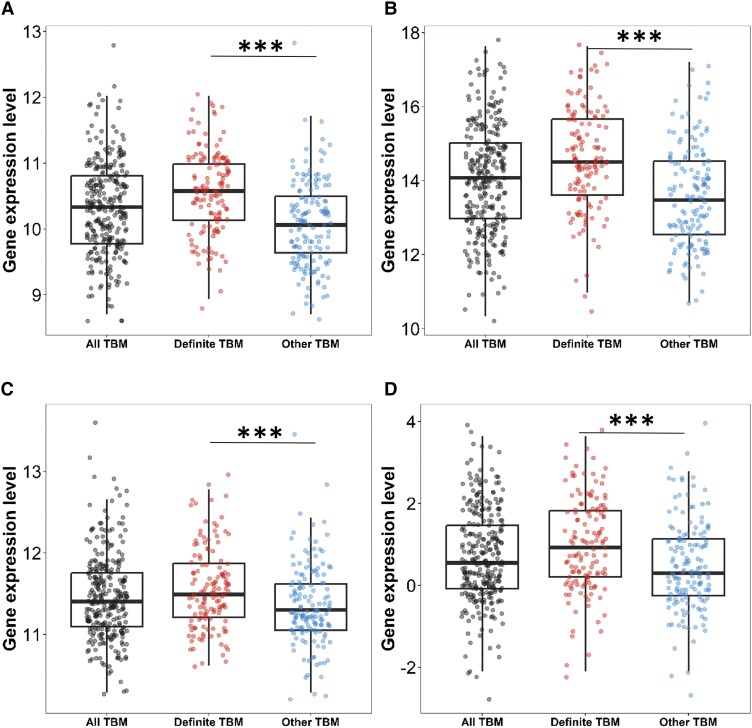
Figure 1.
Three-gene expression and tuberculosis score in all tuberculous meningitis (TBM), definite TBM, and other TBM. All TBM comprises of definite, probable, and possible whilst other TBM comprises of probable and possible. A, DUSP3, (B) GBP5, (C) KLF2, and (D) tuberculosis score. Comparisons of gene expression in all TBM (n = 281, black dots), definite TBM, and other TBM group (n = 147, blue dots). Boxes indicate interquartile range, the line indicates the median, and dots indicate data in individuals. Whiskers extend 1.5 times the interquartile range from the 25th and 75th percentiles. Comparisons between definite TBM versus other TBM were performed using Mann-Whitney U test. ***P < .001.

