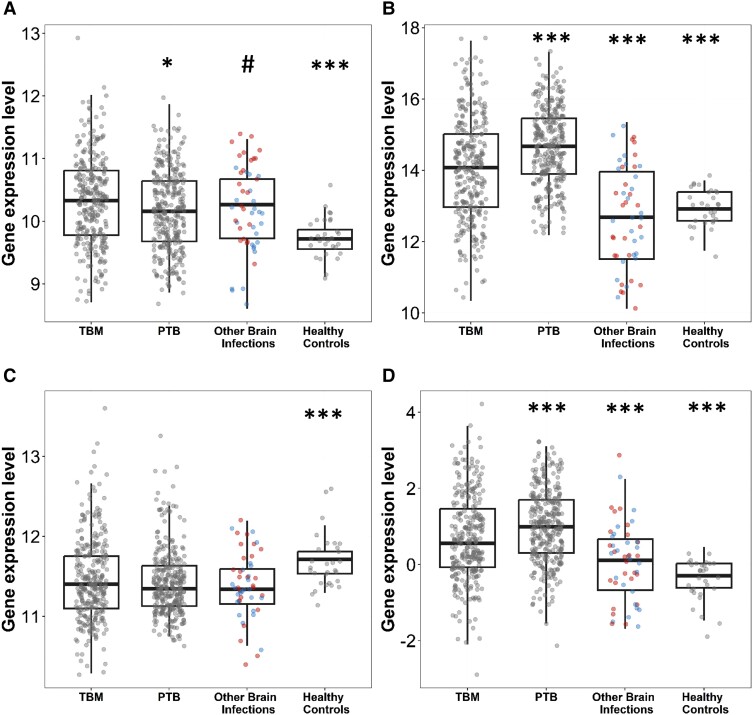
Figure 2.
Three-gene expression and tuberculosis score in tuberculous meningitis (TBM) compared to other groups: (A) DUSP3, (B) GBP5, (C) KLF2, and (D) tuberculosis score. Comparisons of gene expression in TBM (n = 281) and other groups: pulmonary tuberculosis (PTB; n = 296), other brain infections (n = 50), and healthy controls (n = 30). Other brain infections were classified as bacterial (n = 25, red dots) or viral infection (n = 25, blue dots). Boxes indicate interquartile range, the line indicates the median, and dots indicate data in individuals. Whiskers extend 1.5 times the interquartile range from the 25th and 75th percentiles. Comparisons between TBM versus PTB, TBM versus other brain infections, TBM versus healthy control, and bacterial infection versus viral infection were performed using Mann-Whitney U test. Unadjusted multiple testing was performed for exploratory analysis with *P < .05, ***P < .001. Difference in DUSP3 expression between bacterial versus viral infections, #P = .008.

