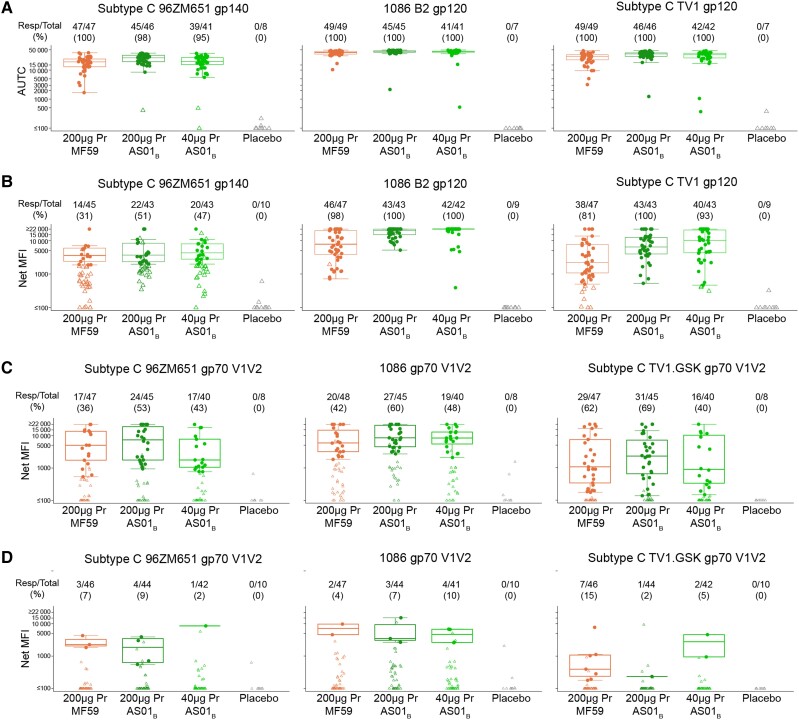
Figure 3.
Binding antibody response against gp120 and V1V2. Samples from the participants collected at (A) 2 weeks after the last vaccination (month 6.5) and (B) 6 months after the last vaccination (month 12) were tested against HIV1 subtype C 96ZM651 gp120, 1086 B2 gp120, and subtype C TV1 gp120. C, Month 6.5 and (D) month 12 samples were also tested against HIV1 subtype C 96ZM651 gp70 V1V2, 1086 B2 gp70, and subtype C TV1 GSK gp70 V1V2. Graphs show (A) nonparametric AUTC and (B–D) net MFI. Numbers above indicate responders/total and percent. The median and boxplots (which display the first and third quartiles, whiskers indicate variability) are based on positive responders only (shown as filled circles); negative responders (below background) are shown as open symbols. Treatment groups are 200 µg Pr + MF59 (orange), 200 µg Pr + AS01B, 40 µg Pr + AS01B, and placebo. Abbreviations: AUTC, area under the baseline subtracted curve; gp, glycoprotein; MFI, mean fluorescence intensity; Pr, protein.

