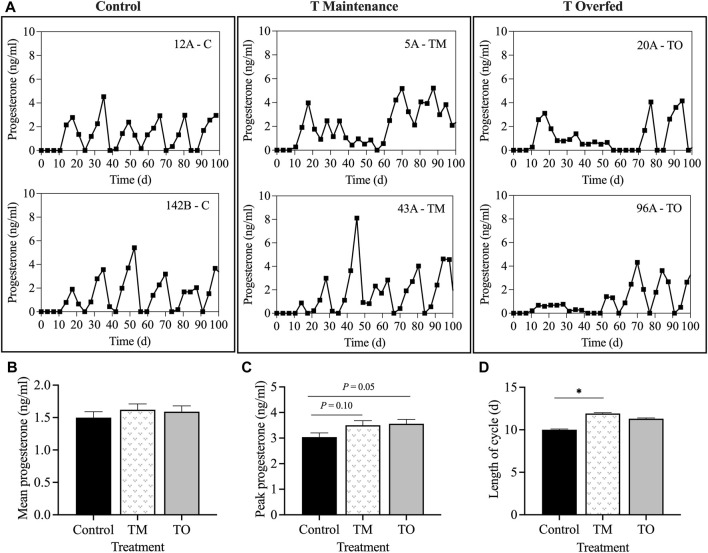
FIGURE 3.
(A) Two representative progesterone profiles of control, testosterone maintenance (TM), and testosterone overfed (TO) females from first ovulation until the end of the first breeding season. (B) mean ± SEM progesterone concentrations during the first breeding season. (C) mean ± SEM peak progesterone concentration during the first breeding season. (D) mean ± SEM length of luteal phase of the estrous cycle between the three treatment groups throughout the first breeding season. *p < 0.05.

