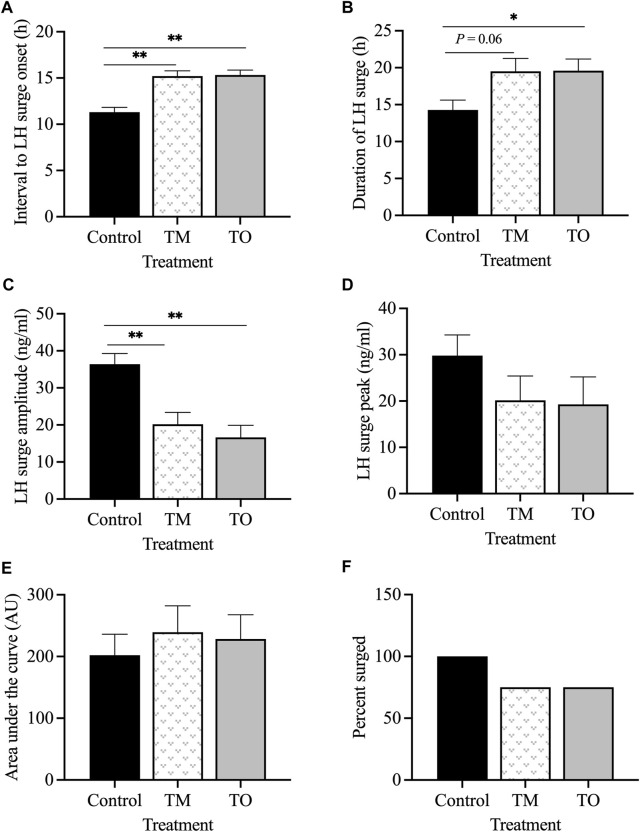
FIGURE 5.
(A) Mean ± SEM interval between the insertion of E2 implants and onset of the LH surge; (B) mean ± SEM duration of the E2-induced LH surge; (C) mean ± SEM amplitude of the E2-induced LH surge; (D) mean ± SEM peak of the E2-induced LH surge; (E) mean ± SEM area under the curve (AUC) of the E2-induced LH surge; (F) percentage of estradiol-induced LH surge response between the three treatment groups during the anestrous period. *p < 0.05; **p < 0.01. C: control; TM: testosterone maintenance; TO: testosterone overfed.

