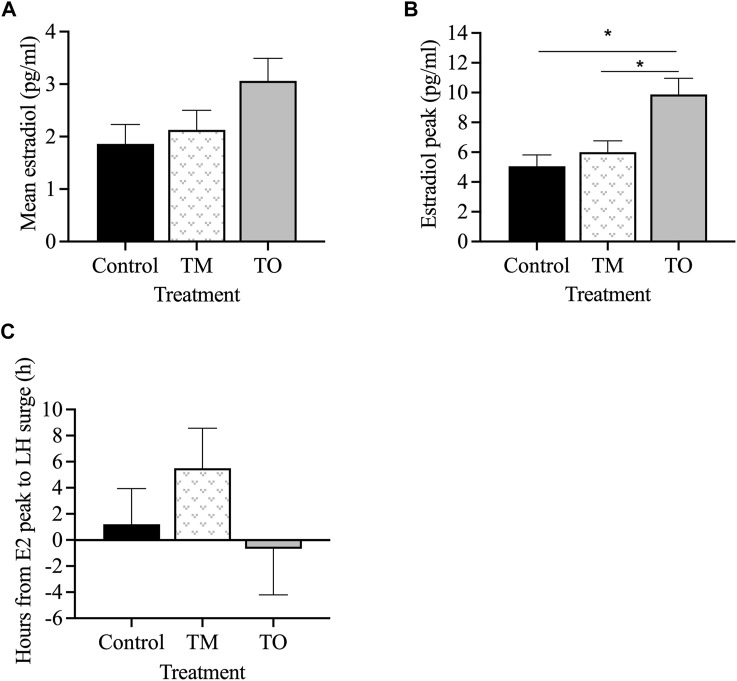
FIGURE 7.
(A) Mean estradiol concentrations, (B) average peak estradiol concentrations, and (C) interval between estradiol peak and onset of the LH surge between the three treatment groups (Control [C], T maintenance [TM], and T overfed [TO]) during the preovulatory surge during the second breeding season. *p < 0.05.

