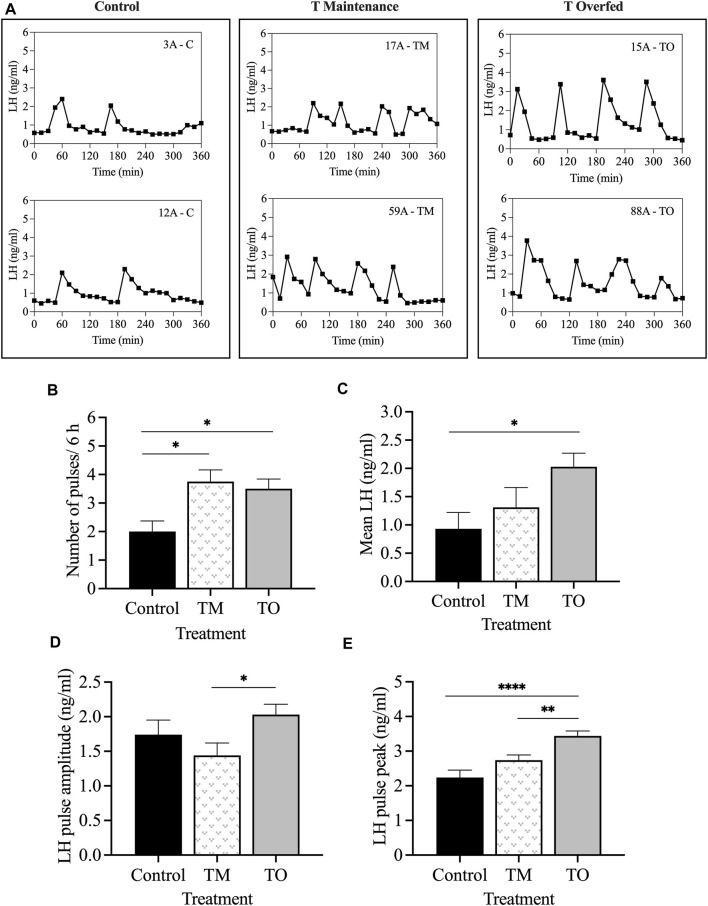
FIGURE 9.
(A) Representative LH pulse profiles of two animals from each of the three treatment groups (Control [C], T maintenance [TM], T overfed [TO]) during the progesterone negative feedback test, conducted during the mid-luteal phase; (B) mean ± SEM number of LH pulses within the 6 h sampling period; (C) mean ± SEM LH concentration; (D) mean ± SEM LH pulse amplitude concentration; (E) mean ± SEM LH pulse peak concentration between the three treatment groups during the progesterone negative feedback test. *p < 0.05; **p < 0.01; ***p < 0.001.

