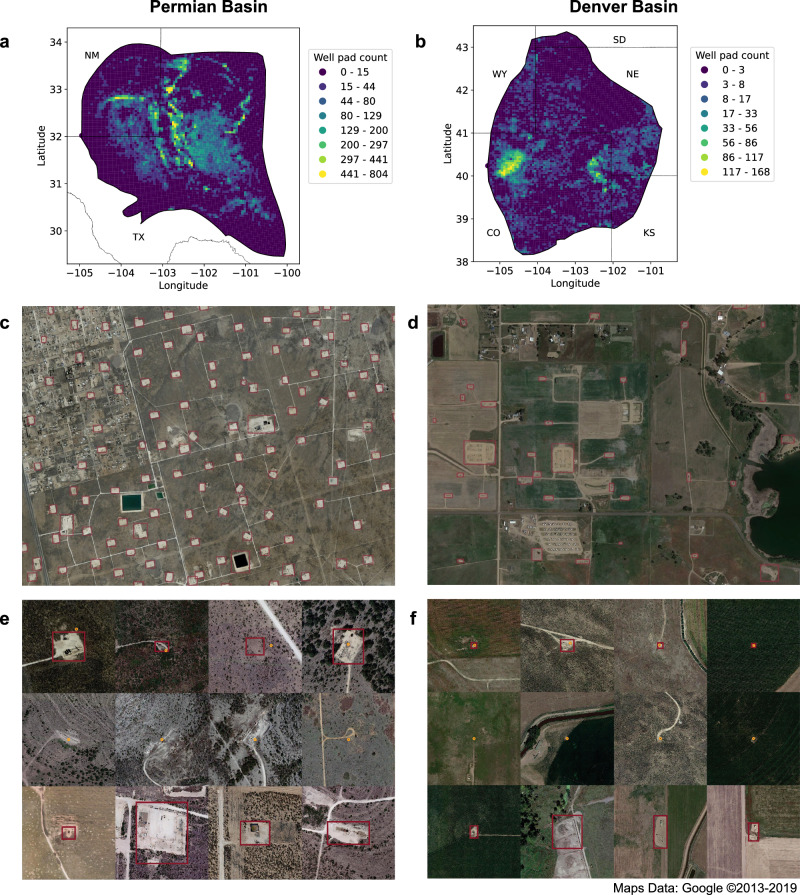
Fig. 1. Visualization of basin-scale well pad deployments in the Permian and Denver basins.
a, b Gridded density heatmaps of detected well pad counts. Each grid cell represents 5 km2. c, d Deployment detections (magenta boxes) from subregions of the basins. e, f Sample deployment detections (magenta boxes) of captured (first row), missed (second row), and new (third row) well pads. Deployment detections are matched against reported sources of data (displayed as orange circles).

