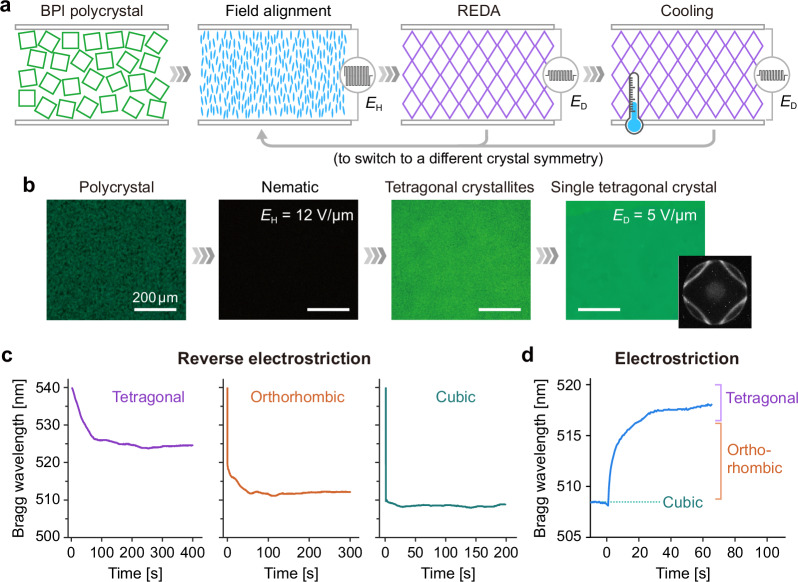
Fig. 3. Reverse electrostriction vs. electrostriction.
a, b (a) Schematic and (b) optical micrographs showing each state of a BPLC in the process of reverse electrostriction and cooling to form a single crystal of target symmetry: initial polycrystal → electrically induced nematic at field strength of EH = 12 V/μm → nucleated crystallites after reducing the applied field strength to ED = 5 V/μm → single tetragonal crystal formed through natural merging of neighboring crystallites (see Supplementary Movie 4 for video). Temperature is maintained at 31.6 °C, ~0.1 °C below the BPI–BPII phase-transition point. Surface-alignment (rubbing) direction is from left to right. c Time-resolved Bragg-reflection wavelength showing different dynamics of reverse electrostriction. The Bragg reflection band rapidly blue-shifts and then settles to a spectral location depending on the directing field strength (ED). The field strengths are 4.0, 2.6, and 0.0 V/μm for the tetragonal, orthorhombic, and cubic symmetries, respectively. d Conventional electrostriction, an electric field at 3.2 V/μm is applied for 60 s to induce lattice deformation.

