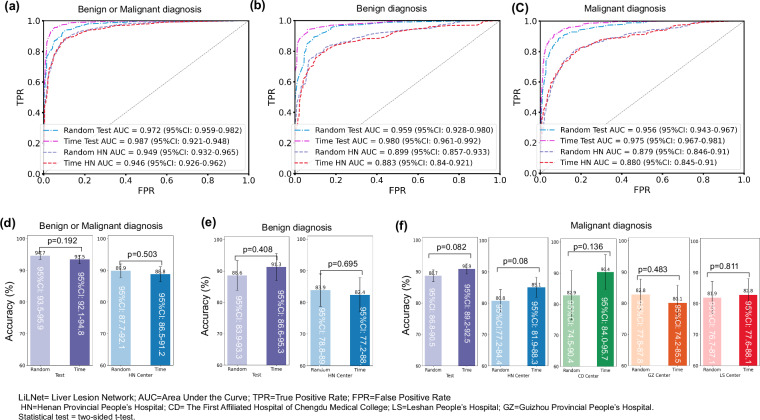
Fig. 6. Comparison of Results between randomly and time-divided data.
a displays ROC curves comparing the differentiation of benign and malignant tumors in the Test and HN external validation sets. b shows ROC curves comparing the differentiation of benign tumors in the Test and HN external validation sets. c presents ROC curves comparing the identification of malignant tumors. d displays ACC for distinguishing between benign and malignant tumors in the Test and HN external validation sets. e demonstrates ACC for distinguishing benign tumors in the Test and HN external validation sets. f provides ACC for identifying malignant tumors in the HN, CD, GZ, and LS validation sets. Source data are provided as a Source Data file Source_data_Figure_6.xlsx.

