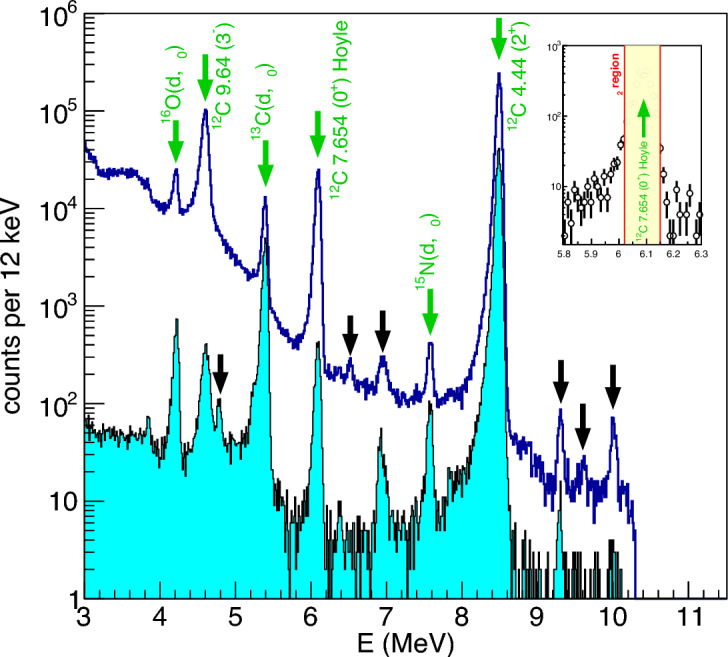
Figure 2.

(Blue spectrum) Energy spectrum obtained with the backward telescope, used as anti-coincidence telescope. Green arrows indicate ejectile energies calculated for the main expected reactions. Black arrows are the energy positions of reactions occurring on minor contaminants present in the target, such as , , . (Cyan-filled spectrum) Same as the blue spectrum, but obtained using only events in which a coincident hit is present at the forward telescope. The background in the proximity of the Hoyle peak is strongly suppressed in the coincidence data. (Insert) A zoomed view of the cyan-filled spectrum in proximity of the peak.
