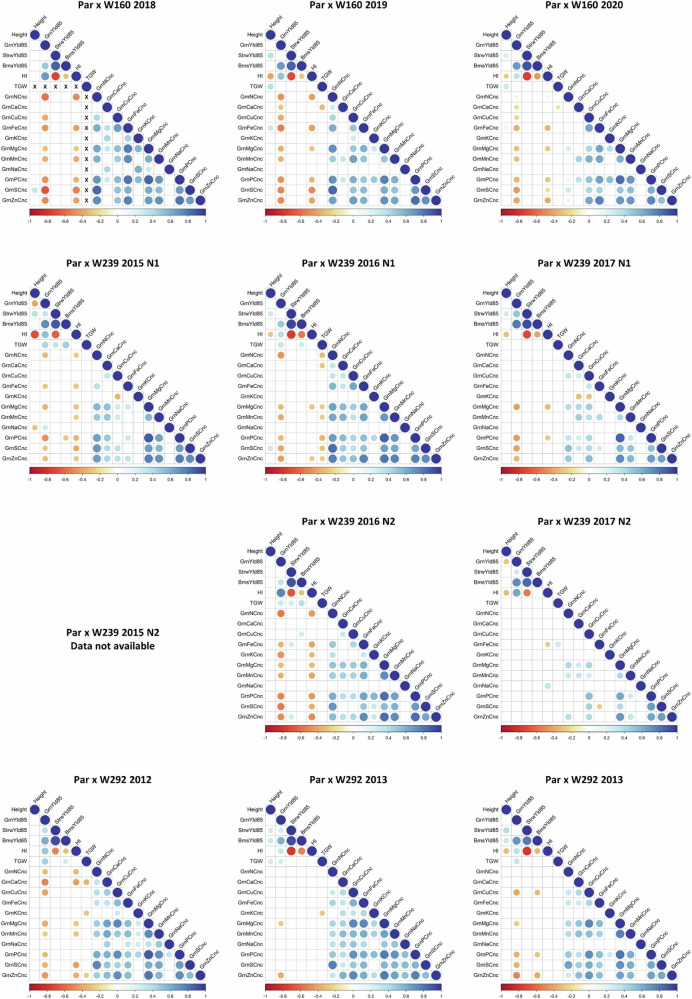
Fig. 1. Correlation matrix plots of grain mineral concentration and yield-related traits.
This figure presents correlation matrix plots that illustrate the relationships between grain mineral concentrations and other traits, including plant height, straw biomass, above-ground biomass, grain yield, harvest index, and thousand grain weight (TGW). These correlations are shown for the three biparental populations across different environments (year, N treatment – where applicable). The colour and size of the circles represent the Pearson correlation coefficient. Only correlations that are statistically significant (p < 0.01) are depicted. Detailed correlation matrices for all measured or calculated traits are provided in Supplementary Data 4. Environment and trait abbreviations can be found in Supplementary Data 1.

