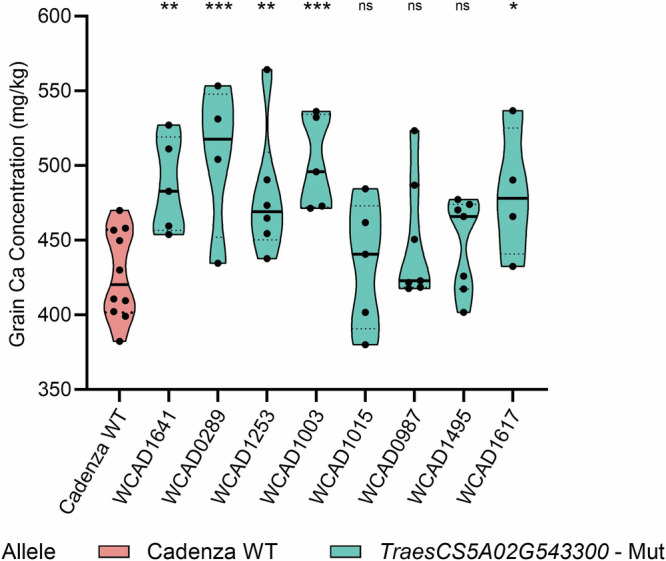
Fig. 4. Violin plots of grain Ca concentration in TILLING mutant lines and WT Cadenza.

This figure presents violin plots of the grain calcium concentration (mg/kg) for eight independent TILLING mutant lines with non-synonymous mutations in TraesCS5A02G543300 (in blue) and the wild type (WT) Cadenza (in pink). The central solid line in each violin represents the median, and the dashed lines indicate the first and third quartiles. The statistical analysis was conducted using ANOVA. Asterisks indicate statistically significant differences compared to WT Cadenza, with significance levels denoted as follows: * for p < 0.05, ** for p < 0.005, and *** for p < 0.0005. For the WT Cadenza, the sample size (n) is 10 individual plants. For the TILLING mutants, the sample size varies from 4 to 7, as it was limited by the number of homozygous plants detected. Plot was created in GraphPad Prism v9.3.1. Source data can be found in Supplementary Data 6.
