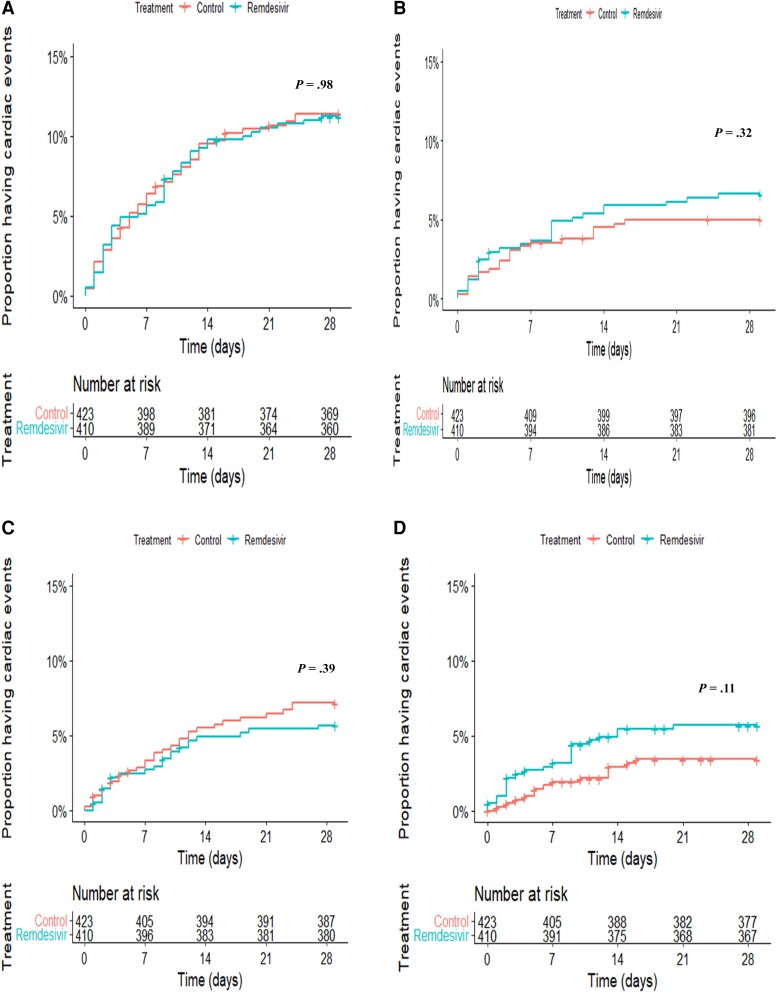
Figure 2.
Kaplan-Meier estimates showing the times to cardiac adverse events from the modified intention-to-treat population in the remdesivir and control groups: overall cardiac adverse events (A), serious cardiac adverse events (B), any nonserious adverse cardiac events (C), and serious arrhythmic events (D). Blue lines show the remdesivir group. Orange lines show the control group. A number-at-risk table is provided for each plot by treatment group.

