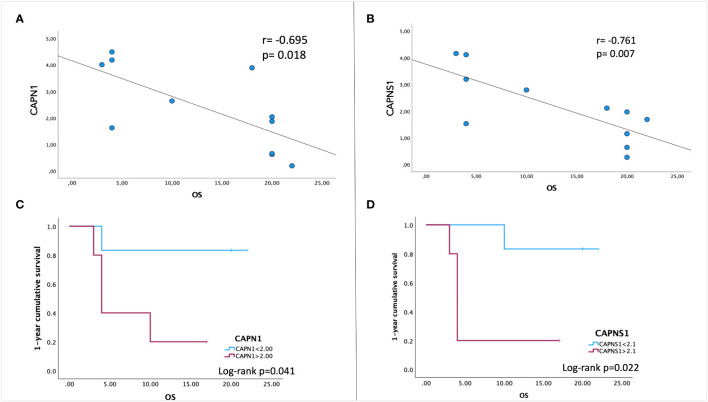
Figure 3.
Pearson correlation between patients’ overall survival (OS) and gene expression levels of CAPN1 (A) and CAPNS1 (B). A negative association is indicated by a negative correlation coefficient (r). (C, D) Kaplan–Meier survival analysis was performed to assess the association between CAPN1/CAPNS1 gene expression levels and OS. To stratify our patient cohort, the values of 2.1 for CAPN1and 2.0 for CAPNS1 (the median expression fold-change to healthy cells) were used as cutoff to evaluate the cumulative 1-year survival. Data were obtained by IBM SPSS (Version 29.0). Exact p-values are specified in the graphs.

