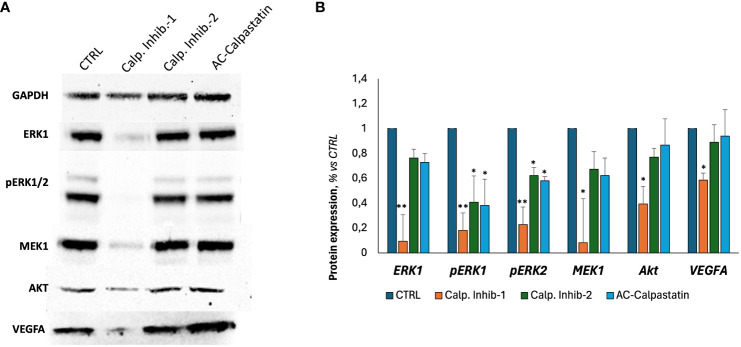
Figure 8.
(A) Representative images of Western blot analyses conducted on GECs treated with calpain inhibitors for 72 h. (B) Densitometric quantification to assess protein expression levels of tested markers, normalized to GAPDH expression level, used as endogenous control, and to untreated CTRL. Data were obtained by Fiji ImageJ. Data are the mean±SD of at least three independent experiments run in triplicate. *p<0.05, **p<0.01.

