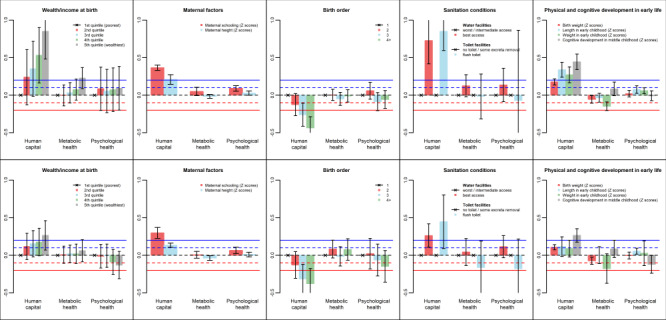
Figure 2.

Linear regression coefficients (y-axis) of the three well-being components according to early life variables (unadjusted models on the top row and adjusted models on the bottom row). The coefficients are expressed as standard deviation changes in the well-being components associated with a standard deviation increase of continuous predictors or the mean difference (in standard deviation units) of the well-being components comparing every level of categorial predictors with its reference level (indicated by × ).
