. 2024 Aug 16. Online ahead of print. doi: 10.1039/d4np00008k

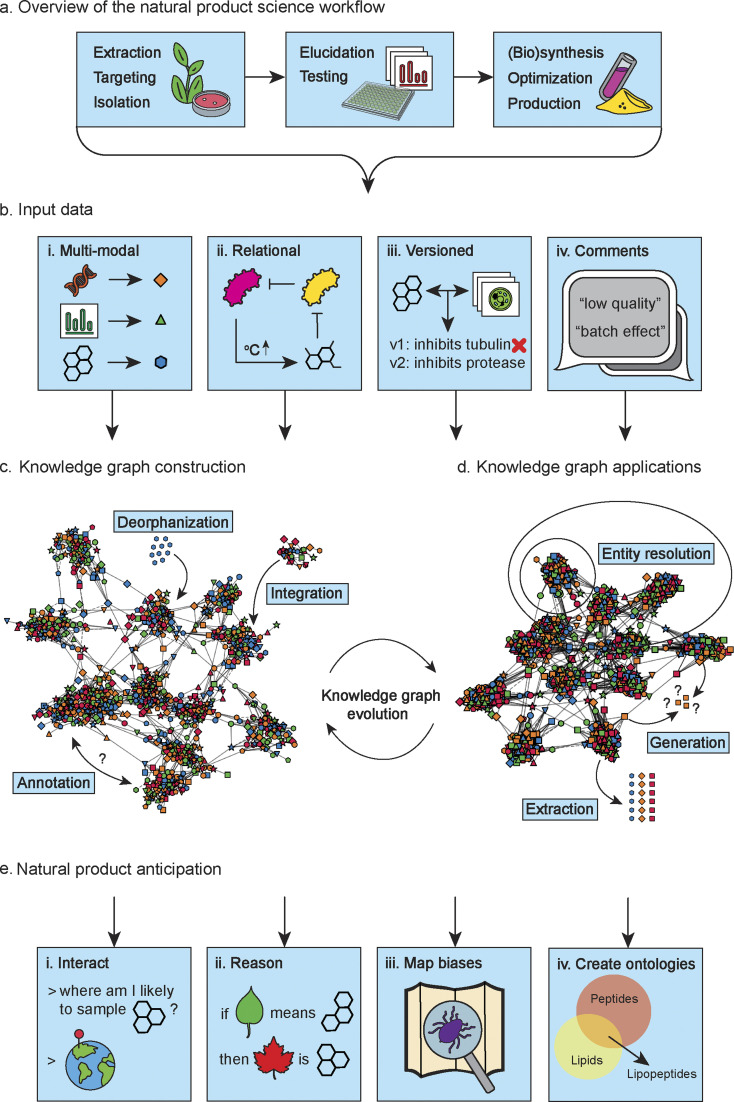
Fig. 1. Overview of the construction, applications, and future perspectives of a natural product science knowledge graph. (a) The prototypical steps in a natural product science workflow that generates different data modalities. (b) Every aspect of natural product science data is used to construct a natural product science knowledge graph. This includes not only the data modalities we generate, but also the relationships between the data types, changes to the data over time, and our objective and subjective descriptions of the data. (c) A natural product science knowledge graph should integrate different datasets (e.g., a metabolomics dataset or a chemical structure database) through creating and annotating relationship edges between the data entities. Deorphanization will play a big part in this effort, as many data types have little explicitly described relationships with other data types. Over time, the knowledge graph will evolve as more and more entities are added and more and more connections between entities are made. (d) At any stage of construction, the constructed knowledge graph can be used for inference, either by using the graph directly, or through first extracting datasets for downstream tasks. The knowledge graph can be used for entity resolution in order to dereplicate and denoise data. (e) In time, we will be able to use the knowledge graph for advanced tasks that will empower natural product science. The knowledge graph could be leveraged by AI in order for scientists to have “a conversation” with the knowledge contained in the graph. For example, for hypothesis creation. As the graph grows, it will contain the necessary information for models to learn causal inference and, for example, anticipate expected molecular scaffolds in previously unseen plants or other organisms based on metadata alone. Additionally, the knowledge graph could be used to map underexplored regions in our datasets and spot biases, as well as it could help us to define the terms to describe our data better. SVG images used and remixed from the SVG repo (https://www.svgrepo.com/) and Bio Icons (https://bioicons.com/).

Fig. 1