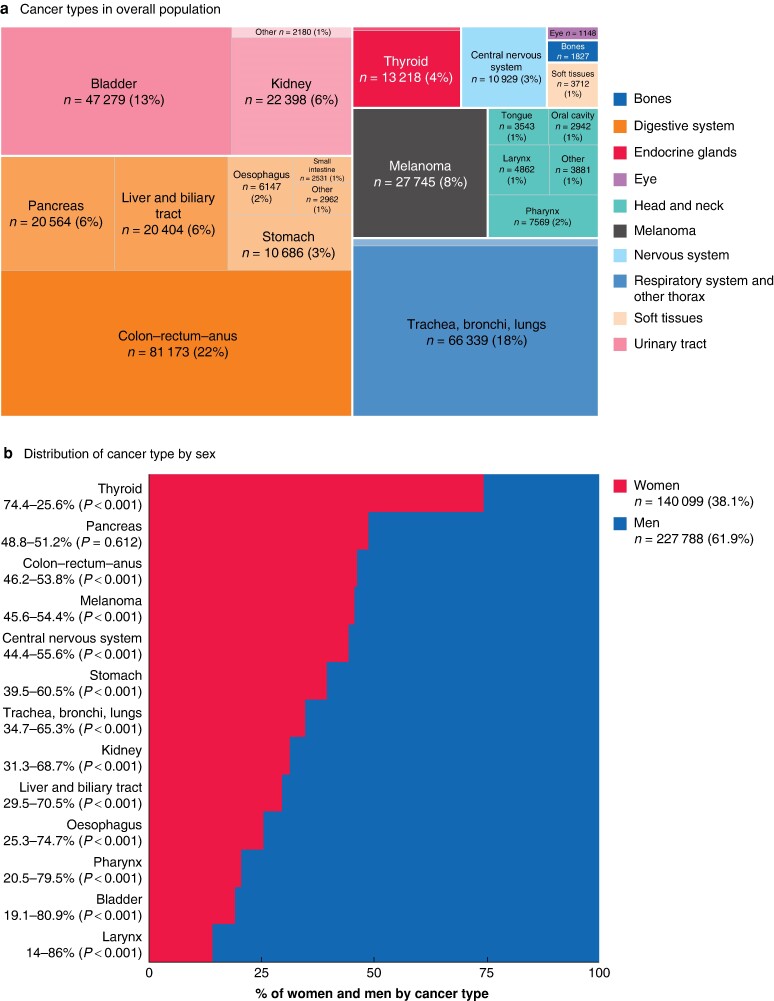
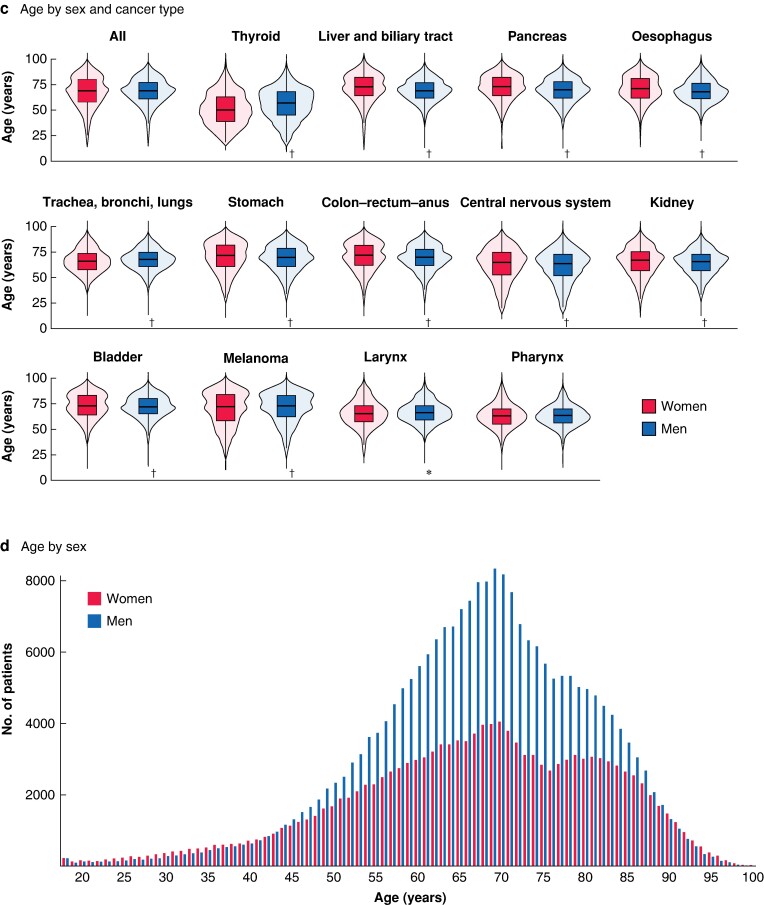
Fig. 1.
Distribution of cancer types and age by sex
a Distribution of cancer types in overall population. b Percentage distribution of cancer types by sex. c Age distribution by sex and cancer type. Horizontal lines, boxes, and outer shaded areas represent the median, interquartile range, and kernel density estimate of the age distribution respectively. *P < 0.050, †P < 0.001 versus women (Mann-Whitney test). d Age distribution by sex.


