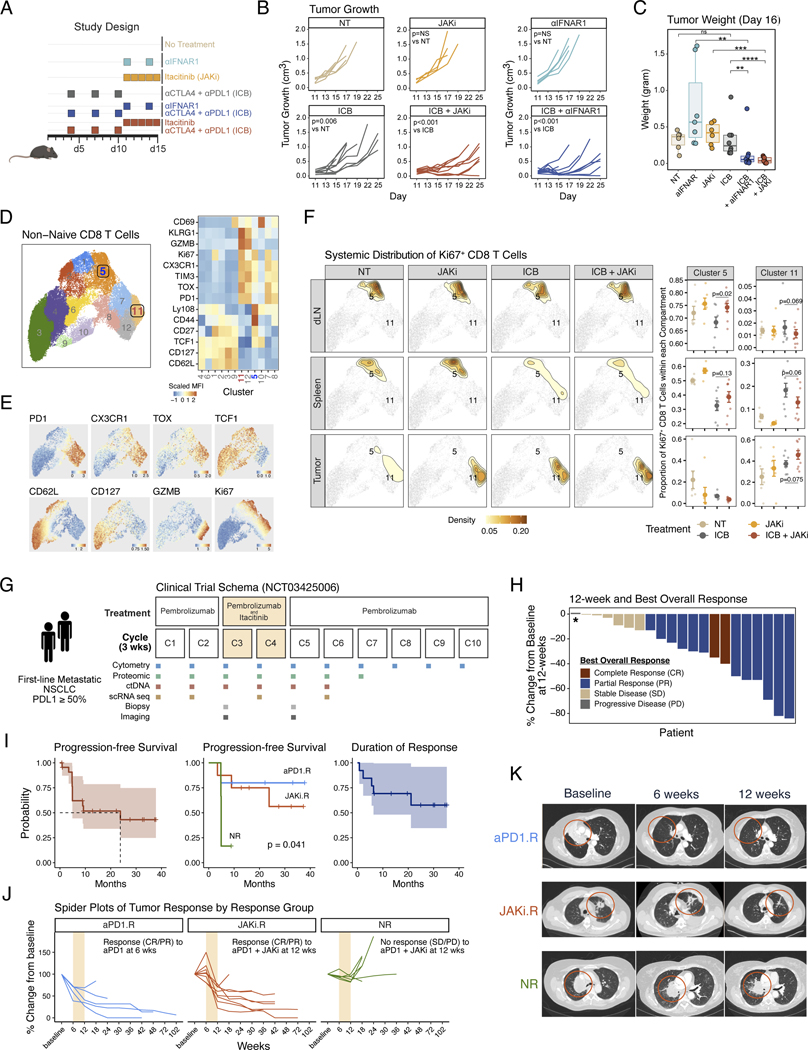
Fig. 1. Pre-clinical and phase 2 clinical trial results of anti-PD1 immunotherapy and a JAK1 inhibitor for non-small cell lung cancer.
(A) Pre-clinical treatment regimen using ICB plus either itacitinib, a JAK1 inhibitor (JAKi), or anti-IFNAR1 antibody for mice bearing resistant B16-derived Res 499 tumors. (B) Mouse tumor growth curves in response to treatment strategy outlined in (A). (C) Mouse tumor weights at day 16 after the indicated treatment. (D) Flow cytometry features from non-naive CD8 T cells from Res 499 mouse tumors, the draining lymph node (dLN), and spleen projected on UMAP space. Shown are 12 FlowSOM clusters (left) along with heat map of scaled MFI for all marker proteins arranged by hierarchical clustering (right). (E) MFI expression of select protein markers overlaid on cluster UMAP. (F) Systemic distribution of all Ki67+ CD8 T cells compared across dLN, spleen, and tumor (left density plots) overlaid on the UMAP from (D) (light grey dots). Locations for clusters 5 and 11 are labeled on the density plot overlay. The relative frequencies in each tissue compartment for cells belonging to cluster 5 or 11 are also shown (right dot plots). (G) Schema of phase 2 clinical trial for pembrolizumab and delayed administration of itacitinib for first-line metastatic NSCLC with tumor PDL1 ≥ 50%. Times of treatment, sample collection, and response assessment by imaging are shown relative to each 3-week treatment cycle. (H) Waterfall plot of 12-week tumor response for each patient. Patients are color-coded by best objective response (BOR) that includes response with additional follow-up beyond 12-weeks. Asterisk indicates a patient who clinically progressed prior to the 12-week assessment. (I) Survival curves for overall progression-free survival, progression-free survival by response group defined in (J), and overall duration of response. The 95% confidence intervals are shaded. (J) Spider plots indicating change in tumor measurements from baseline for patients in each response group. Patients were categorized as either an anti-PD1 responder (aPD1.R) if a complete response (CR) or partial response (PR) was observed at 6-weeks after pembrolizumab but prior to itacitinib, a JAKi responder (JAKi.R) if a CR or PR was not observed until 12-weeks after itacitinib, or a non-responders (NR) if a CR or PR was not observed at 12-weeks. Cycles when JAKi was added to anti-PD1 are highlighted in bisque. (K) Representative computerized tomography (CT) scan from aPD1.R, JAK1.R, and NR at baseline, 6 weeks, and 12 weeks. Significance for tumor growth was determined by a mixed-effect regression model. For pairwise comparisons, a two-sided Wilcox test or t-test was used for non-parametric or parametric data, respectively. Survival differences were determined by a log-rank test. Error bars represent SEM.

