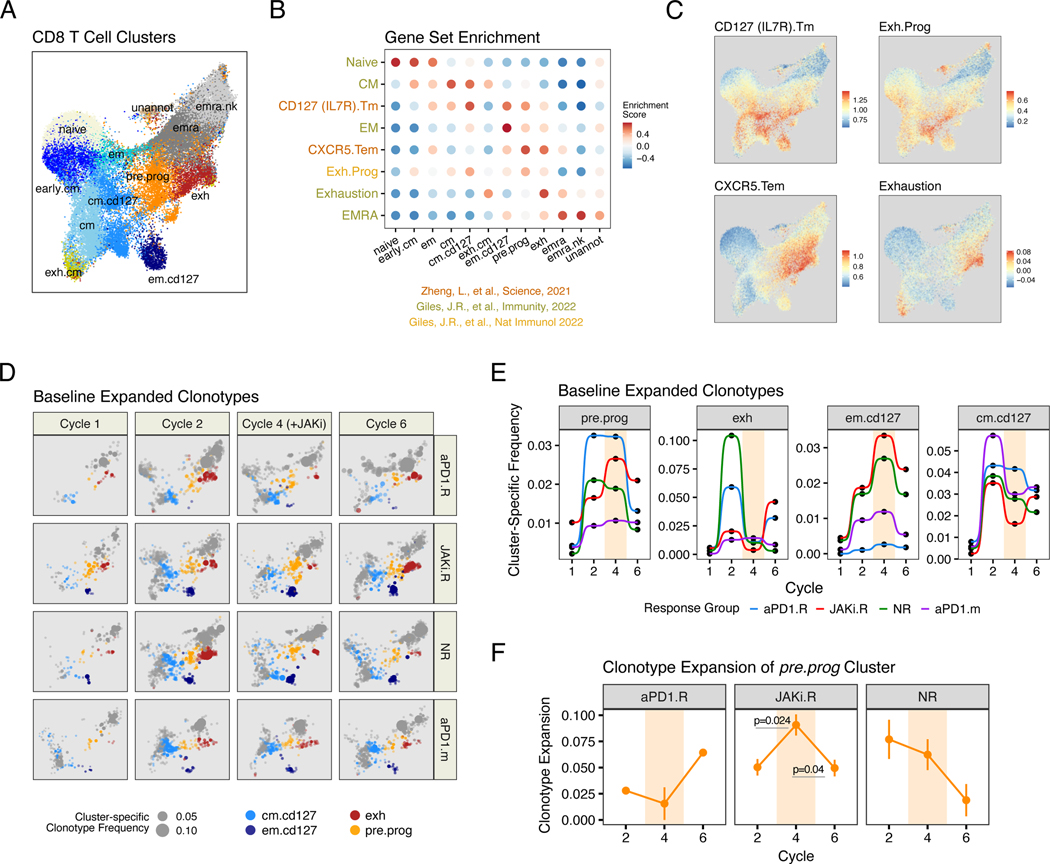
Fig. 3. Evolution in CD8 T cell clonotypes after anti-PD1 immunotherapy and JAK inhibition correlates with treatment and response.
(A) UMAP of peripheral CD8 T cell subtypes analyzed by scRNA/TCR-seq from the start of cycles 1, 2, 4, and 6 from aPD1.R patients (n=2), JAKi.R patients (n=3), NR patients (n=3), and a separate cohort of patients treated with anti-PD1 monotherapy (aPD1.m) (n=2). (B) GSVA enrichment scores for each CD8 T cell cluster (x-axis) using the indicated CD8 T cell subtype gene set (y-axis). Source of the gene sets are indicated. (C) Enrichment scores for select gene sets overlaid on the UMAP from (A). (D) UMAP from (A) showing the frequency (expansion) of clonotypes belonging to the indicated color-coded CD8 T cell subtype (size of dot). Clonotypes that belonging to other subtypes are shown in grey. (E) Cumulative frequencies for expanded TCR clonotypes belonging to the indicated CD8 T cell subtype. Data for individual patients are pooled by treatment group. Cycles when JAKi was added to anti-PD1 are highlighted in beige.
(F) Clonotype expansion score (measuring degree of clonality) for pre.prog CD8 T cells from each indicated response group. Cycles when JAKi was added to anti-PD1 are highlighted. For longitudinal data, significance was determined by a repeated measures ANOVA using a mixed effect model and post-hoc interaction analysis. Error bars represent SEM.

