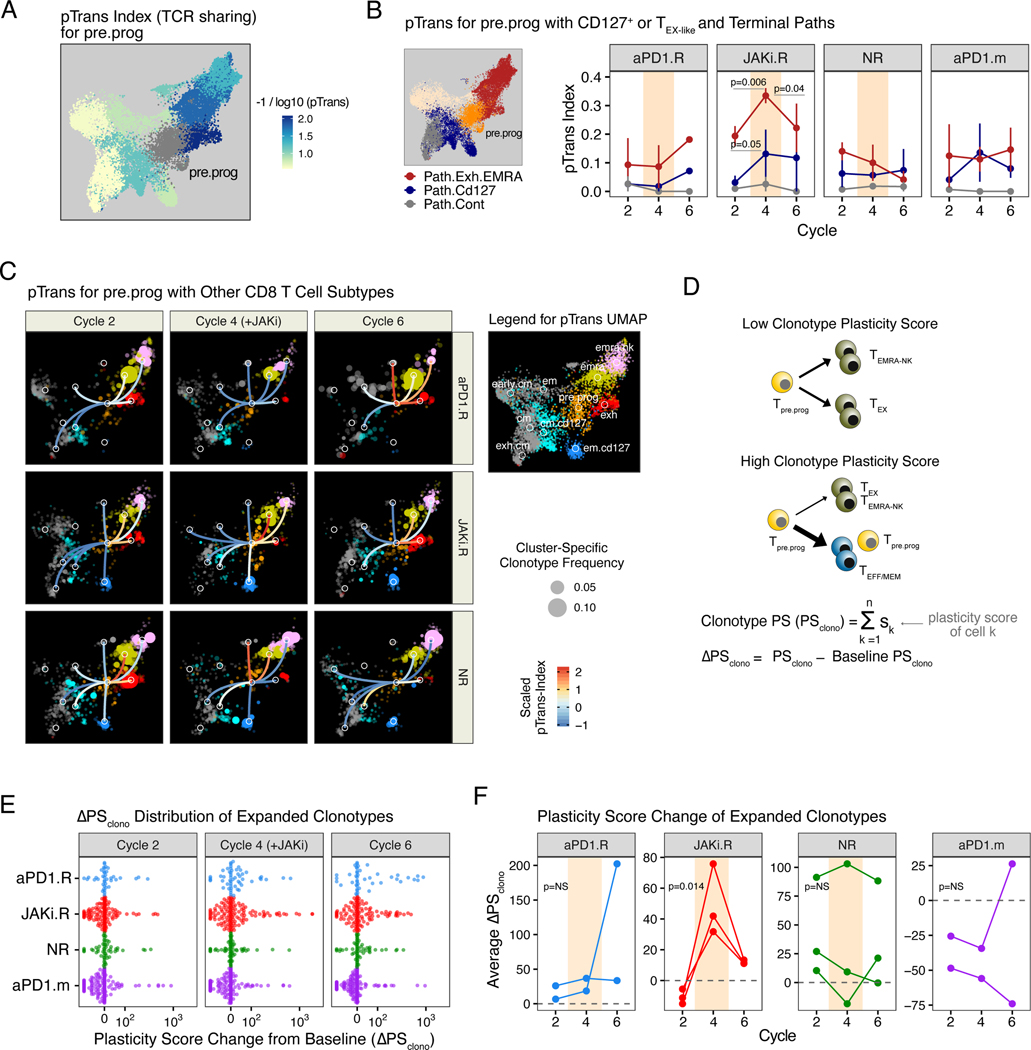
Fig. 4. Response to combined JAK inhibition and anti-PD1 immunotherapy is associated with alterations to CD8 T cell differentiation dynamics and clonotype plasticity.
(A) Pairwise transition (pTrans) index values (measuring TCR sharing) from the pre.prog subtype to other subtypes overlaid on the UMAP shown in Fig. 3A. (B) pTrans-index values between pre.prog CD8 T cells and either exh and terminal EMRA (emra, emra.nk) clusters (Path.Exh.EMRA, red), or em.cd127 and cm.cd127 clusters (Path.Cd127, blue). For comparison, results to the unrelated cm and exh.cm clusters (Path.Cont) are also shown. (C) pTrans-index values between the pre.prog subtype and other subtypes (legend in right margin) overlaid on a UMAP (from Fig. 3A) of expanded CD8 T cell clonotypes faceted by treatment cycle and response group. Edges connecting nodes from the pre.prog subtype to other subtypes are color-coded by the pTrans-index value (higher scores indicate greater TCR sharing and hence developmental relatedness, the absence of edges indicate no detectable sharing). Subtype-specific clonotype frequency is represented by dot size. (D) Schema and derivation of the plasticity scores (PS) using the pTrans-indices for each CD8 T cell subtype and the ΔPSclono using the difference of PS values from baseline. (E) ΔPSclono of all expanded clones colored by response group and faceted by treatment cycles. Positive ΔPSclono represents an altered clonotype subtype composition resulting from an increased plasticity (F) Mean ΔPSclono for patients in each of the indicated response groups. For longitudinal data, significance was determined by a repeated measures ANOVA using a mixed effect model and post-hoc interaction analysis. Error bars represent SEM.

