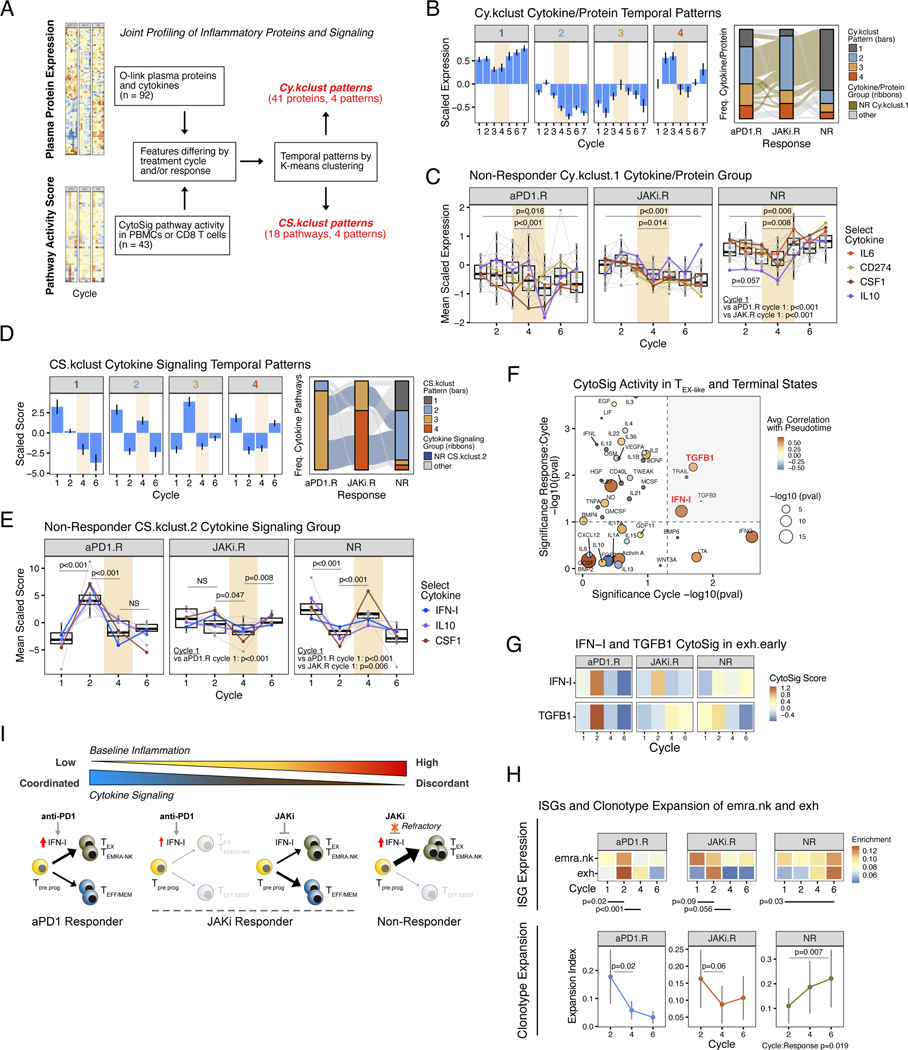
Fig. 5. Refractoriness to JAK inhibition and persistent inflammation are associated with terminal CD8 T cell differentiation and therapy failure.
(A) Schema for joint profiling of plasma cytokines and immune signaling activity and their classification into temporal expression patterns. (B) Temporal expression patterns for plasma cytokines/proteins (Cy.kclust, left bar plots) along with their distribution in each response group (right alluvial plots). The ribbon in the alluvial plot is color-coded to track how Cy.kclust.1 cytokines/proteins from NR patients (tan-colored) change patterns in other response groups. (C) Expression of proteins/cytokines belonging to the Cy.kclust.1 pattern from NR patients (tan ribbon in alluvial plot from (B)) is shown for all response groups. Select suppressive cytokines are color-coded. P-values are for comparisons using all proteins/cytokines plotted (grey dots and lines). Cycles when JAKi was added to anti-PD1 are highlighted in bisque. (D) Temporal expression patterns for cytokine signaling activity in immune cells (CS.kclust, left bar plots) along with their distribution in each response groups (right alluvial plots). The ribbon in the alluvial plot is color-coded to track how CS.kclust.2 pathways from NR patients (blue-colored) change patterns in other response groups. (E) Activity score of cytokine pathways belonging to the CS.kclust.2 pattern from NR patients (blue ribbon in alluvial plot from (D)) is shown for all response groups. Select suppressive cytokines and IFN-I are color-coded. P-values are for comparisons using all pathways plotted (grey dots and lines). Cycles when JAKi was added to anti-PD1 are highlighted in bisque. (F) Cytokine pathway activity associated with CD8 T cell differentiation, treatment cycle, and response. Correlation of CD8 T cell pathway activity with pseudotime from trajectory analysis using all CD8 T cell subtypes are color-coded with circles size representing significance of the correlation (small grey dots are non-significant). The significance of changes in pathway activity in emra.nk and exh subtypes across treatment cycles (main effect) is shown on the x-axis, and the significance of whether changes across cycles differs by response group (interaction effect) is shown on the y-axis. Dotted lines represent significance levels (p=0.05 for main effect, p=0.10 for interaction effect) and grey upper-right quadrant show pathways that significantly differ by main and interaction effects. (G) Inferred CytoSig signaling activity for IFN-I and TGFB1 in exh CD8 T cells across treatment cycles. Shown are averages for each response group. Significance values are shown in (F). (H) Average ISG expression in terminal exh and emra.nk subtypes for each response group across treatment cycles (top). P-values for the indicated comparisons are shown. Also shown are the average expansion index (measure of clonality) for these subtypes (bottom). (I) Model summarizing relationship between inflammation, cytokine signaling in immune cells after anti-PD1, the impact of IFN-I on CD8 T cell differentiation toward either terminal or less committed states, and consequence of JAK inhibition. For longitudinal data, significance was determined by a repeated measures ANOVA using a mixed effect model and post-hoc interaction analysis. Error bars represent SEM.

