Figure 2.

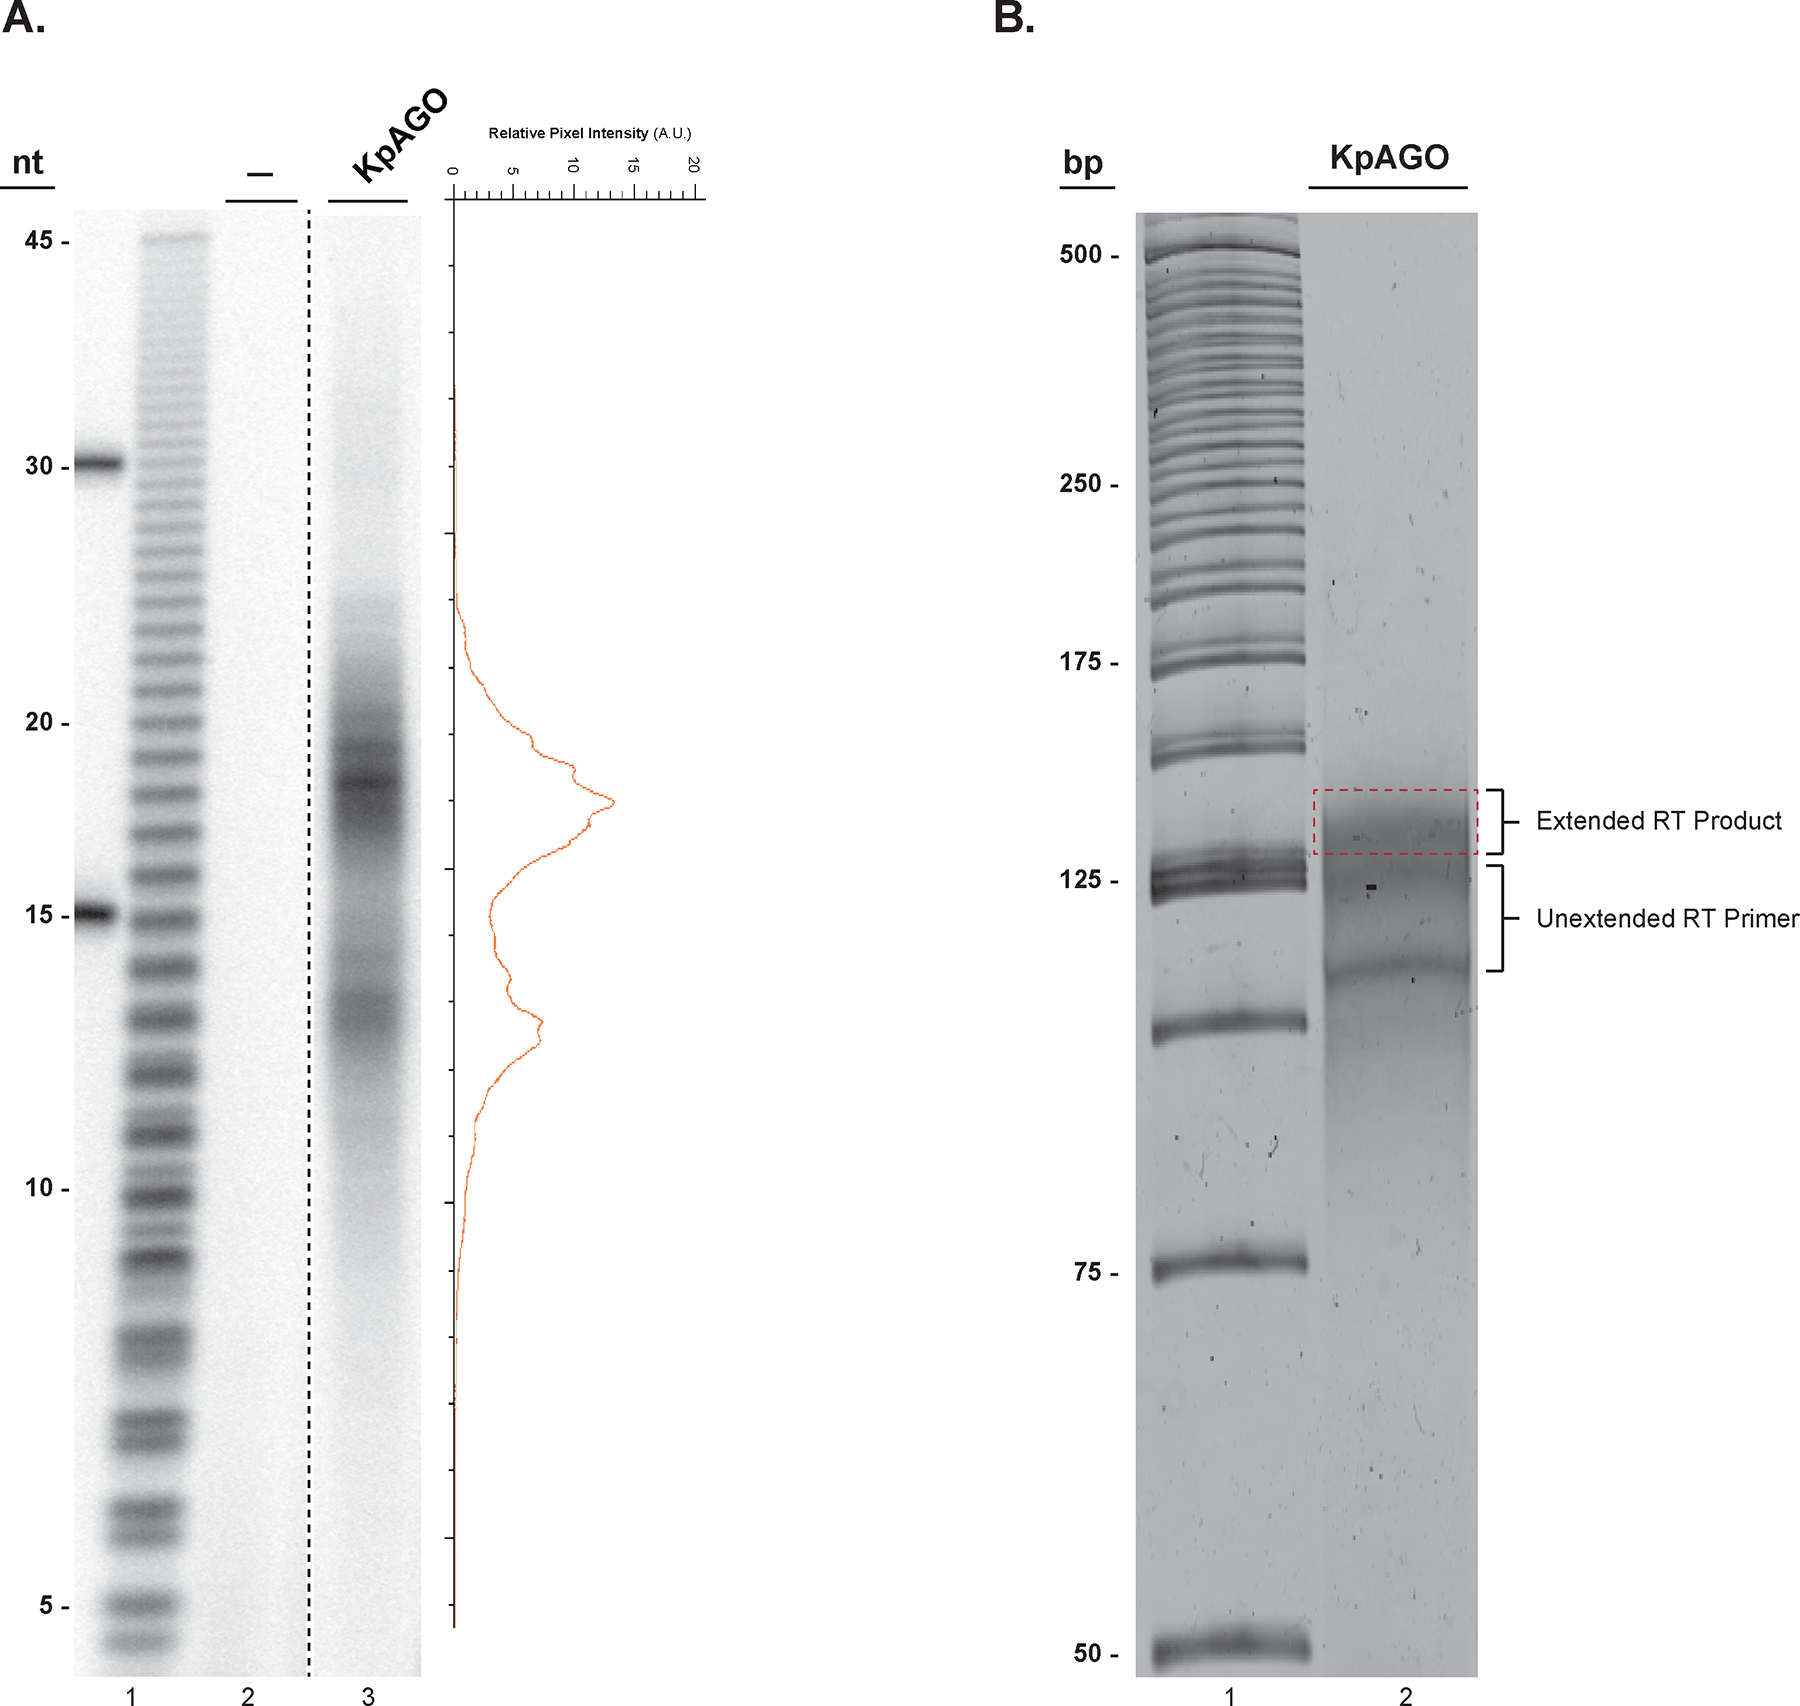
Input RNA size estimation and reverse transcription product size selection. A. A 16% denaturing urea PAGE of 32P-labeled endogenous E. coli RNAs co-purified from KpAGO (lane 3) and a mock sample (lane 2). On the right the pixel intensity profile of lane 3 shows the presence of two distinct RNA populations centered at 13 and 19 nts in length from the purified KpAGO. A hydrolyzed poly uridine 45-mer was used to estimate relative size of the input RNA (lane 1). B. A SYBR® gold stained 10% denaturing urea-PAGE gel showing the extended RT product smear located above the unextended RT primer (lane 2). The excised gel region for elution of the DNA product is indicated by a dashed red rectangle. The 25-bp DNA ladder is in lane 1.
