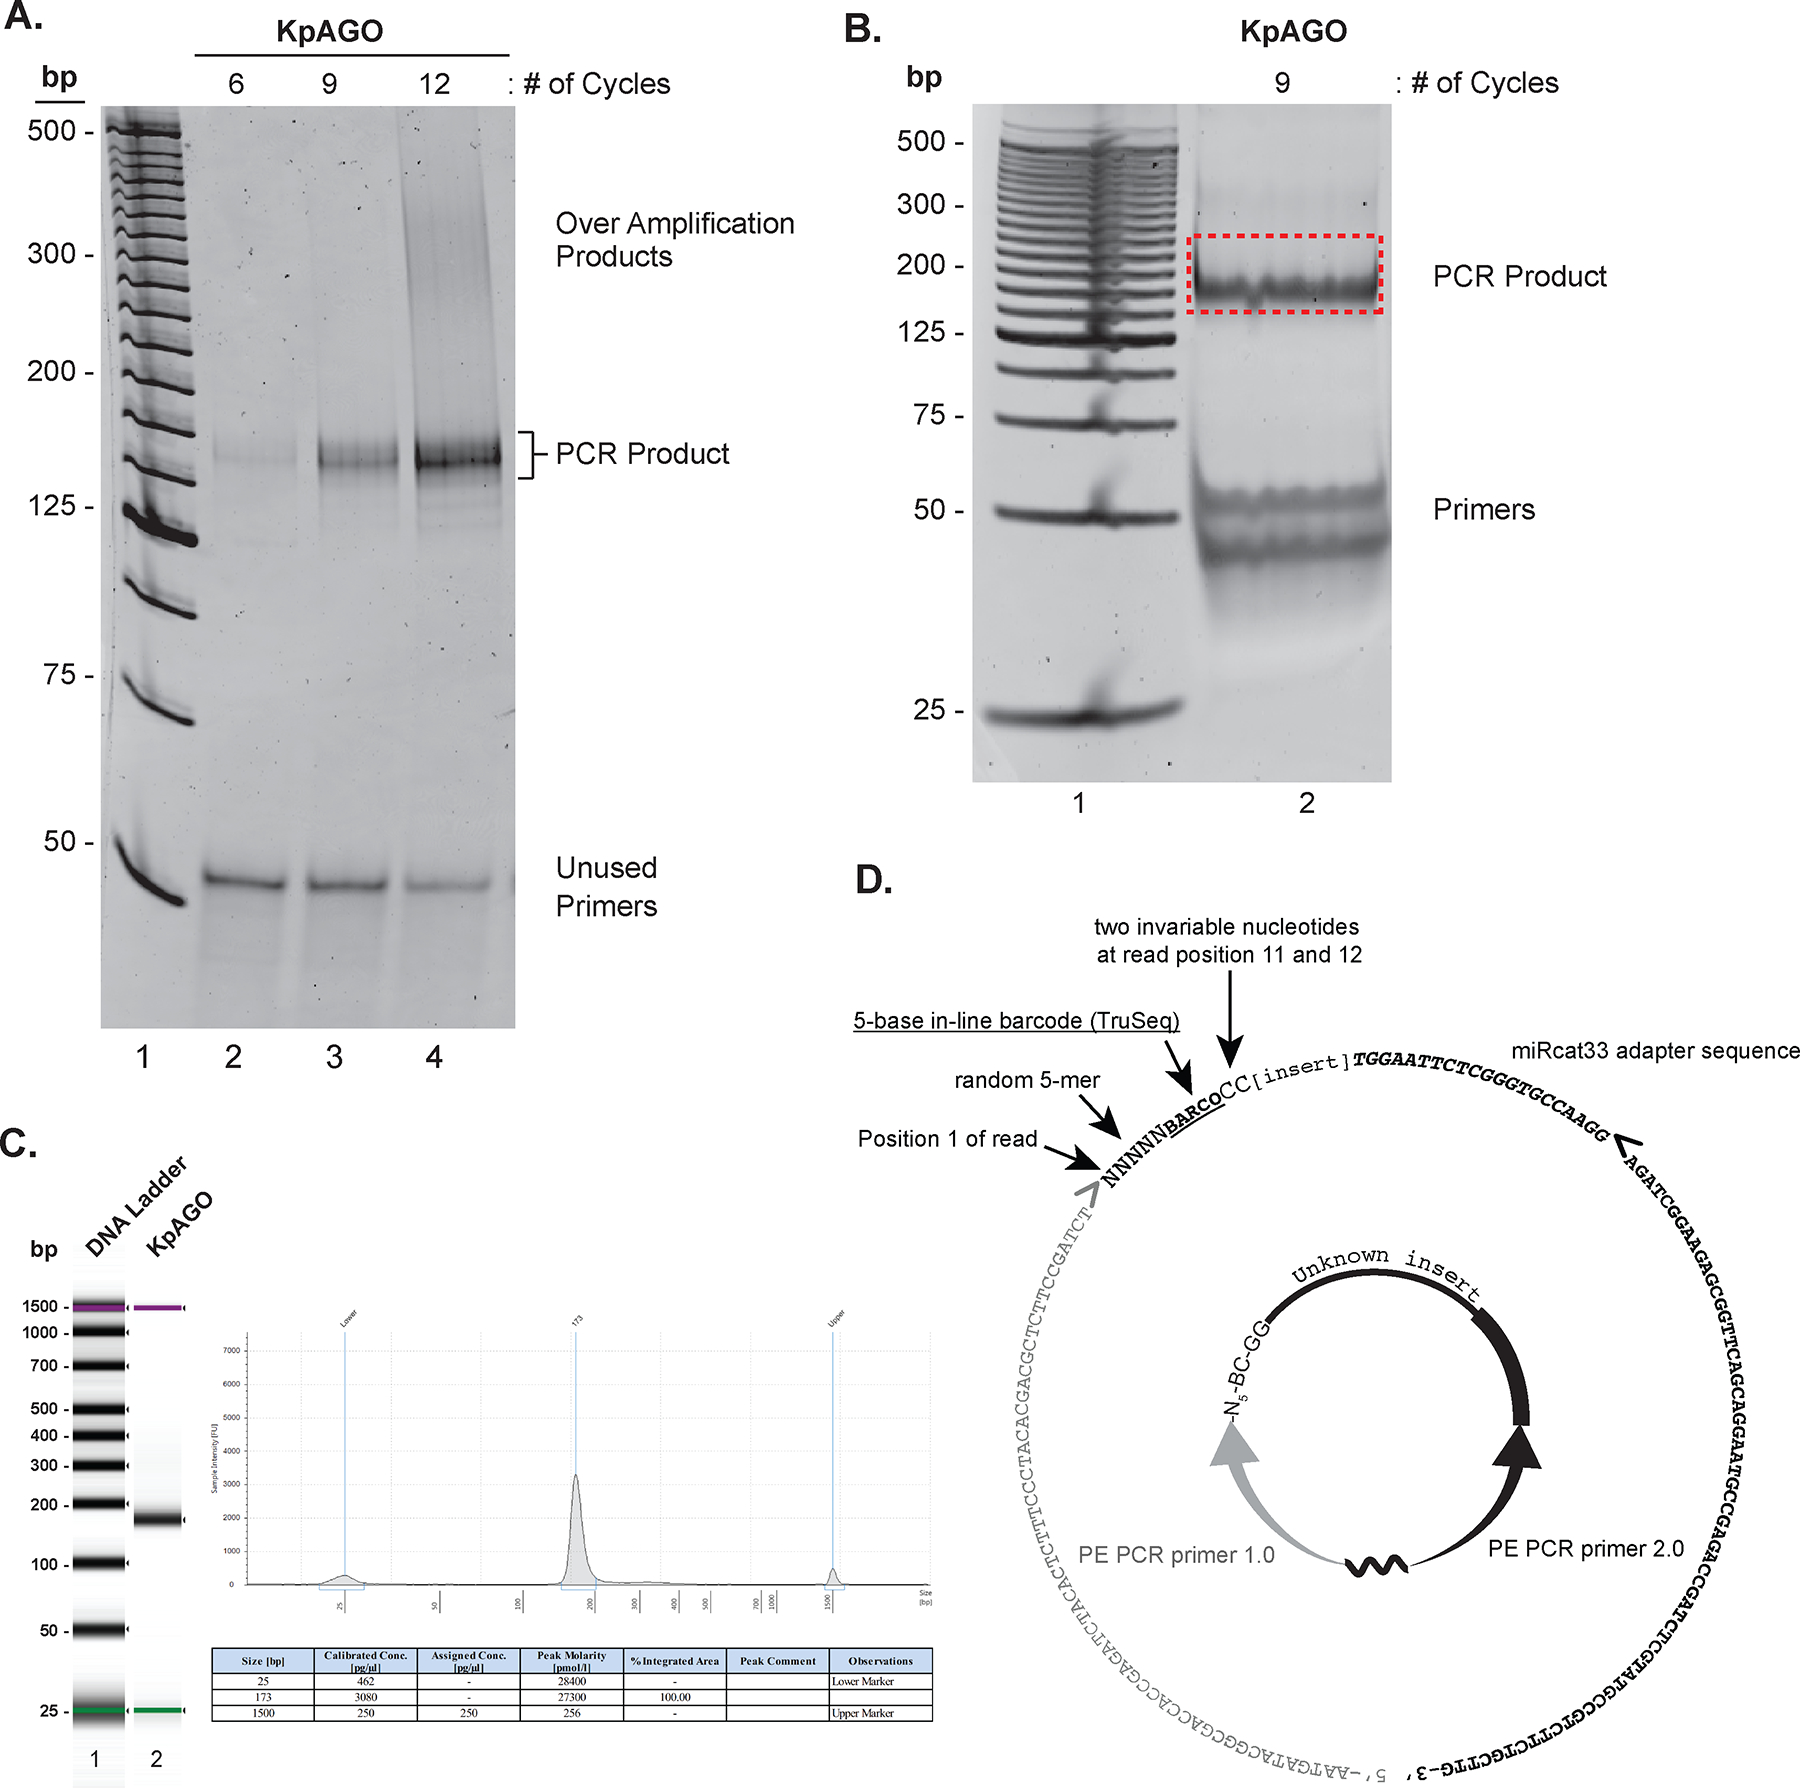
Figure 3.

PCR amplification and size estimation of NGS libraries. A. SYBR® gold stained 8% nondenaturing PAGE-gel showing specific PCR products, over-amplification products, and unused primers (lanes 2–4; each species is indicated on the right) in small scale PCRs performed for increasing number of cycles indicated on top of each lane. The 25-bp DNA ladder is in lane 1. B. SYBR® gold stained 8% nondenaturing PAGE showing the product band and unused primers (labeled on the right) from large scale PCR (lane 2). The 25-bp DNA ladder is in lane 1. The gel fragment excised to purify DNA for NGS is indicated vy a red-dotted rectangle. C. The Bioanalyzer report of the purified PCR product from B. On the left is a virtual gel image of the DNA ladder (lane 1) and cDNA library of KpAGO-bound RNAs (lane 2). On the right is the histogram showing the size of the cDNA library along with size markers (top) and a table with summary of size and amount quantification of the library (bottom). Note that while Bioanalyzer analysis also provides sample concentration (see table), fluorescent DNA binding dye based quantification provides more accurate quantification of DNA amount. D. The circularized cDNA product as in Figure 1 is shown in the center. The corresponding sequence of the final PCR product in 5’ to 3’ direction is shown as the outer circle, and its different segments are individually labeled. Right and left pointing angled brackets indicate the start position of DNA synthesis during PCR. The grey right-pointing angled bracket also indicates where the Illumina first-read sequencing primer begins extension.
