FIGURE 6.

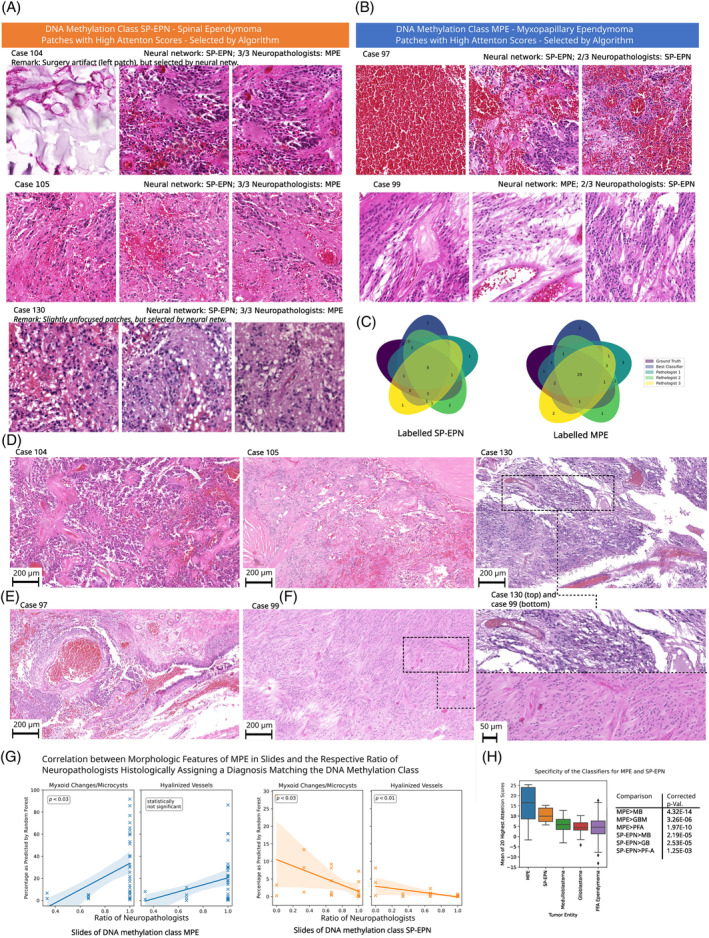
Comparison to neuropathologists. (A) Patches with high attention scores from cases with DNA methylation class MPE, that were histologically assigned differently by the majority of participating neuropathologists. Here, the patches are algorithmically selected—the reader is referred to (D) and (E) for representative overview images as selected by neuropathologists. (B) Corresponding patches for cases with DNA methylation class SP‐EPN. (C) Venn diagrams showing the number of concordantly and dis‐concordantly classified cases of the participating neuropathologists, our classifier and the DNA methylation class for MPE and SP‐EPN. (D) High‐quality images representative for the cases from (A), as selected by human experts. (E) Corresponding images for cases from (B). (F) Representative high‐resolution images of exemplary cases from (D) and (E), as selected by human experts. (G) Linear regression models for the relationship between the average accuracy of human neuropathologists per slide and the relative prevalence of myxoid changes/microcysts and hyalinized vessels (left panel: slides with MPE ground truth, right panel: slides with SP‐EPN ground truth). 95% confidence intervals are indicated and the p‐values demonstrate statistical significance. (H) Average attention over the 20 highest attended patches for different tumor entities (left panel; boxes range from the first to the third quartile of the data and the whiskers extend from the box by 1.5× interquartile range). The specificity of our classifier is visible by significantly higher average attention for MPE/SP‐EPN ependymomas than for medulloblastomas (MB), glioblastomas (GB) and PF‐A ependymomas (right panel, p‐values represent one‐tailed t‐tests).
