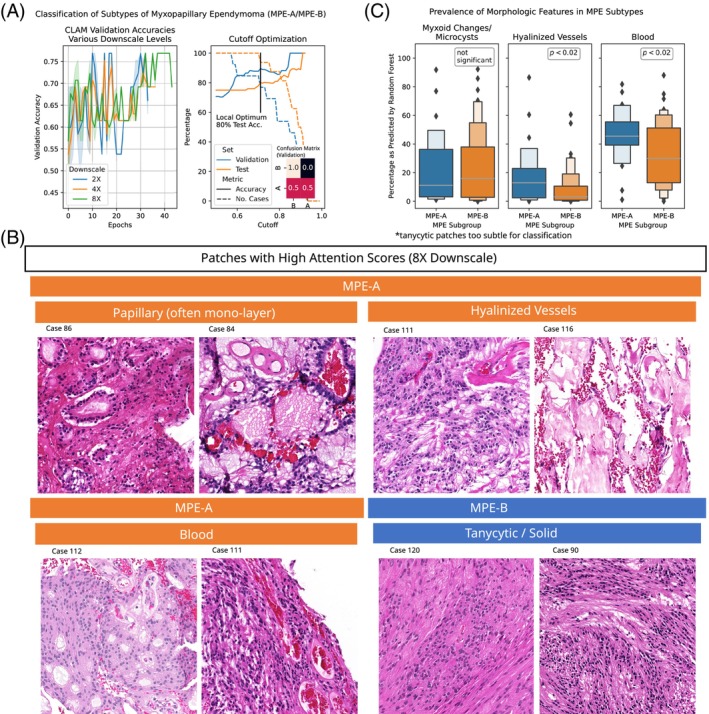
FIGURE 7.

Histology‐based classification of MPE subtypes MPE‐A and MPE‐B. (A) Validation accuracies of CLAM models during training for various downscale levels (left panel). The accuracy can be further optimized by rejecting samples with high uncertainty (right panel). (B) Representative patches for the two MPE subtypes with high attention scores from the test and validation set at 8× downscale. (C) Percentage of tissue area per slide labeled to exhibit predominant myxoid changes/microcysts, hyalinized vessels or blood by RandomForest. Hyalinized vessels and blood show statistically significant differences (one‐sided t‐tests, p < 0.05), whereas myxoid changes/microcysts are not specific to a MPE subgroup.
