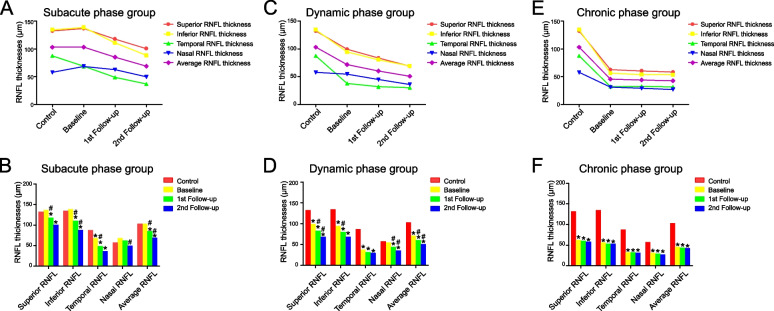
Fig. 1.
The changes in RNFL thicknesses of each quadrant and the 360˚ averages for the healthy controls and G11778A LHON patients of different disease duration groups during follow-up period. Line diagram (A) and bar diagram (B) showed that the temporal RNFL thickness of LHON patients in the subacute phase group (disease duration < 6 months) was already significantly thinner than that of normal controls at the time of enrollment (P < 0.01), while RNFL thickness in the remaining quadrants and the average RNFL thickness were thicker than that of normal controls with no significant difference. By the 1st follow-up, subacute phase group showed reductions in RNFL thickness of each quadrant and the average thickness compared to baseline values, with significant decrease in RNFL thickness in temporal quadrant (P < 0.01), superior quadrant (P = 0.03), inferior quadrant (P < 0.01), and the average (P < 0.01). By the 2nd follow-up, patients in the subacute phase group showed further reductions in RNFL thickness of each quadrant and the average thickness compared to the measurements at the 1st follow-up visit; the decrease in RNFL thickness in the inferior quadrant (P = 0.02), nasal quadrant (P = 0.02) and the average (p = 0.01) reached significant differences. Line diagram (C) and bar diagram (D) showed that dynamic phase group (disease duration = 6–12 months) had significant decrease in RNFL thickness of each quadrant and the average thickness compared with normal controls, except the RNFL thickness in nasal quadrant (P = 1.00). RNFL thickness of each quadrant and the average thickness were ultimately significantly thinner than that of normal controls during follow-up (P < 0.01). Line diagram (E) and bar diagram (F) showed that all quadrants and the mean RNFL in the chronic phase group (disease duration > 12 months) were already significantly thinner than those in the normal control group at the time of enrollment (P < 0.01). And as the disease progressed, there was still a trend for further thinning of the RNFL. *P < 0.05 when compared with normal control. #P < 0.05 when compared with previous measurements

