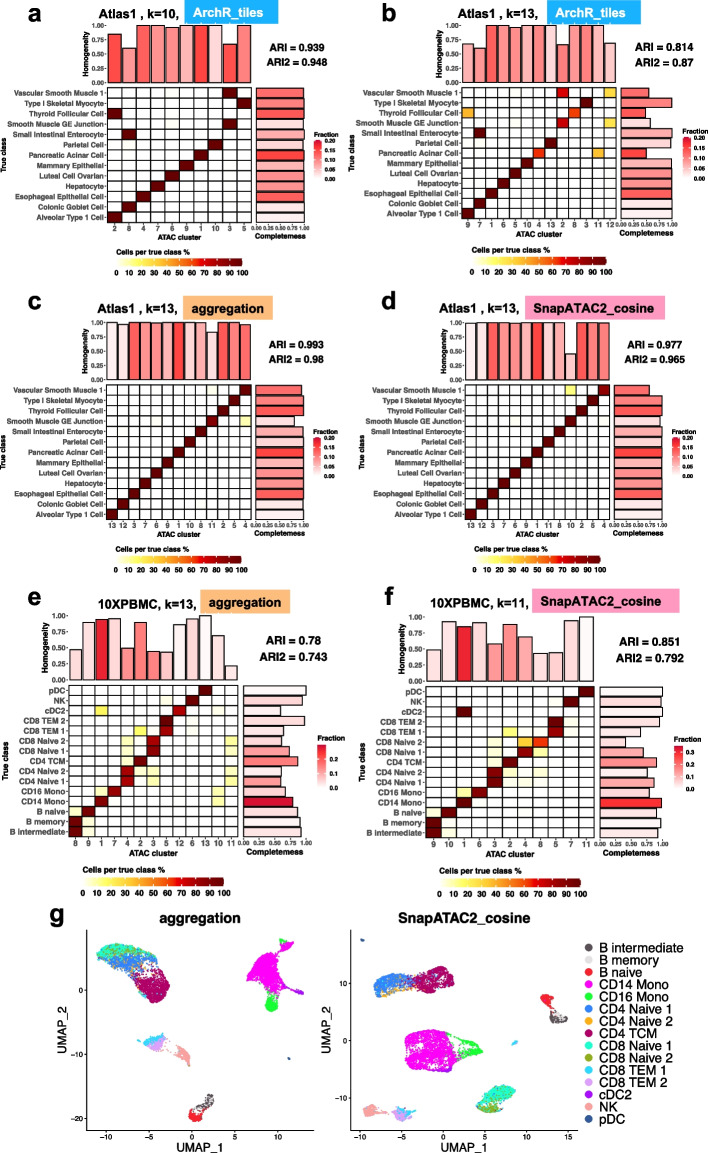
Fig. 4.
a-f True classes and their fractions of agreement with the predicted clusters. a and b are ArchR_tiles on Atlas1, c and d are aggregation and SnapATAC2_cosine on Atlas1, and e and f are aggregation and SnapATAC2_cosine on 10XPBMC. The x-axis is the predicted clusters, and the y-axis is the ground truth classes. The colors of tiles indicate the proportion of cells from the corresponding true class (each row sums up to one). A clearer diagonal structure indicates better agreement. ARI and ARI2 are calculated and shown on the top right. The bar plot on top shows the value of AV (the “Methods” section) and can be interpreted as the homogeneity of the corresponding clusters. The bar plot on the right shows the value of AW and represents the completeness of each true class in the prediction. The color of the bars shows the proportion of cells in each cluster/ground truth class. In title, the corresponding datasets, methods, and number of clusters are indicated. g Corresponding UMAP given by aggregation and SnapATAC2_cosine on dataset 10XPBMC. The aggregation method did not resolve correctly CD14 vs CD16 monocytes, as well as CD4 vs CD8 naive T cells

