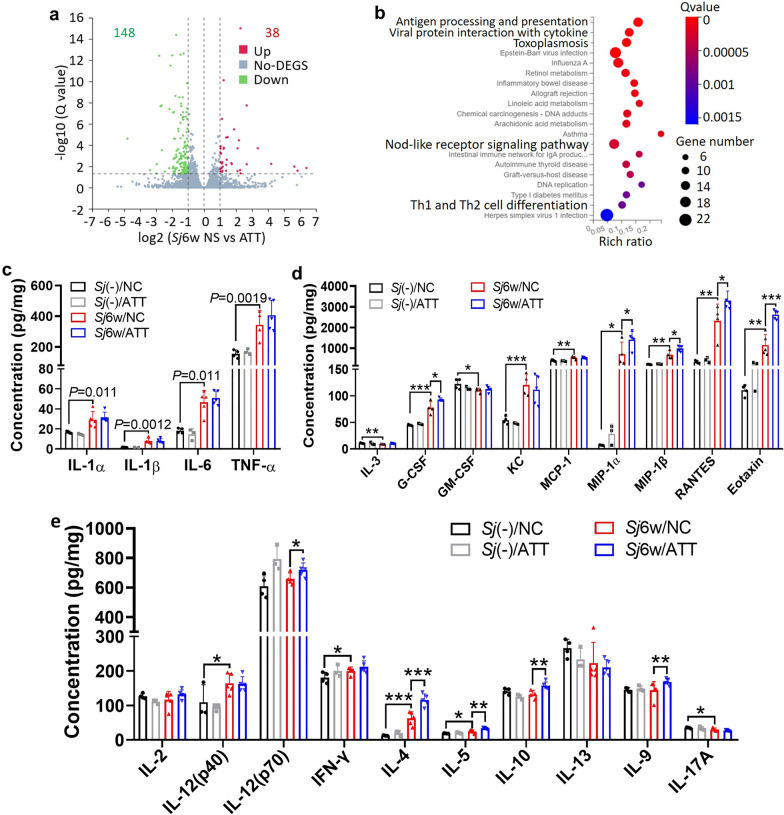
Fig. 3.
RNA-seq and multi-cytokine analysis indicated the immunomodulatory effects of ATT on the liver of mice with 6 weeks of S. japonicum infection. a Volcano plot illustrating the DEGs in S. japonicum-infected mice liver, with or without ATT treatment. The X axis represents the log2 fold change, while the Y axis shows the log10 (adjusted P value). In this plot, red and green symbols highlight upregulated and downregulated genes, respectively, while gray symbols indicate genes with no significant difference. The threshold for significance is a set at an adjusted P value < 0.05 and |log2 fold change| > 1; b Kyoto Encyclopedia of Genes and Genomes (KEGG) pathway enrichment analysis identifies significant pathways affected by DEGs in the infected mice liver, with or without ATT treatment. The X axis indicates −log10 (P value), and the Y axis lists the names of affected pathways. c–e Concentrations of 23 cytokines were measured using Bio-Plex Pro-Mouse Group I Cytokine 23-plex assay. These cytokines include: pro-inflammatory cytokines (IL-1α, IL-1β, IL-6, TNF-α) (c), colony-stimulating cytokines or chemokines (IL-3, G-CSF, GM-CSF, KC, MCP-1, MIP-1α, MIP-1β, RANTES, Eotaxin) (d), and activatory and differentiating cytokines for innate lymphoid cells or T cell subsets (IL-2, IL-12 (p40), IL-12 (p70), IFN-γ, IL-4, IL-5, IL-10, IL-13, IL-9 and IL-17A (e). Data represent mean ± SD from different experimental groups and were analyzed by t-test (n = 4–6). Significant differences are indicated by *P < 0.05 and **P < 0.01

