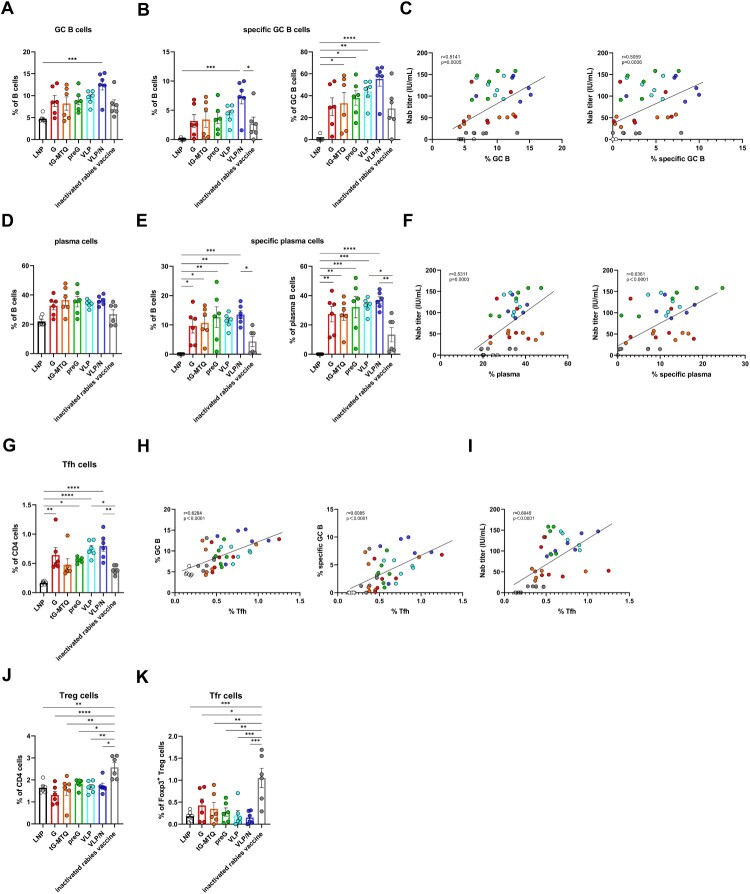
Figure 5.
RABV mRNA vaccines resulted in potent GC responses. Mice immunized i.m. with G, tG-MTQ, preG, VLP, or VLP mRNA, or inactivated rabies vaccine. Inguinal lymph nodes were collected 10 d after the second immunization (n = 6). (A) The proportion of total GC B cells (CD3−B220 + IgD−GL7+) in B cells. (B) The proportion of total RABV-specific GC B cells in B cells and total GC B cells. (C) Spearman correlation of day 24 Nab titre and lymphatic total GC B cells and RABV-specific GC B cells frequency. (D) The proportion of total plasma cells (CD3−B220 + CD138+) in B cells. (E) The proportion of total RABV-specific plasma cells in B cells and total plasma cells. (F) Spearman correlation of day 24 Nab titre and lymphatic total plasma cells and RABV-specific plasma cells frequency. (G) The proportion of total Tfh cells (CD3 + CD4 + CXCR5 + PD-1 + Foxp3−) in CD4+ T cells. (H) Correlation between lymph node Tfh cell frequency and total GC B cells or RABV-specific GC B cells frequency. (I) Correlation between day 24 Nab titre and lymph node Tfh cell frequency. (J and K) Lymph node Treg (CD3 + CD4 + Foxp3+), and Tfr (CD3 + CD4 + CXCR5 + PD-1 + Foxp3+) cell frequencies after the second immunization (n = 6). * P < 0.05; ** P < 0.01; *** P < 0.001; **** P < 0.0001; ns, no significant difference. Data represent mean ± SEM.

