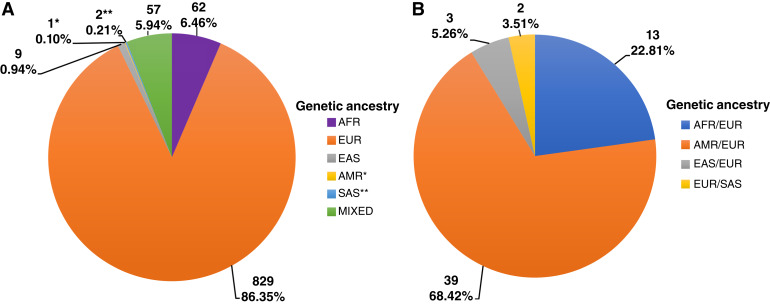
Figure 1.
Diversity of genetic ancestry estimates from PDXNet models. A, Inferred genetic ancestry for 960 models across all cancer types. B, Top two categories for 57 “MIXED” samples with no category >70%. Numbers and percentages in each box reflect the models assigned to that category based on estimates from the SNPweights analysis.

