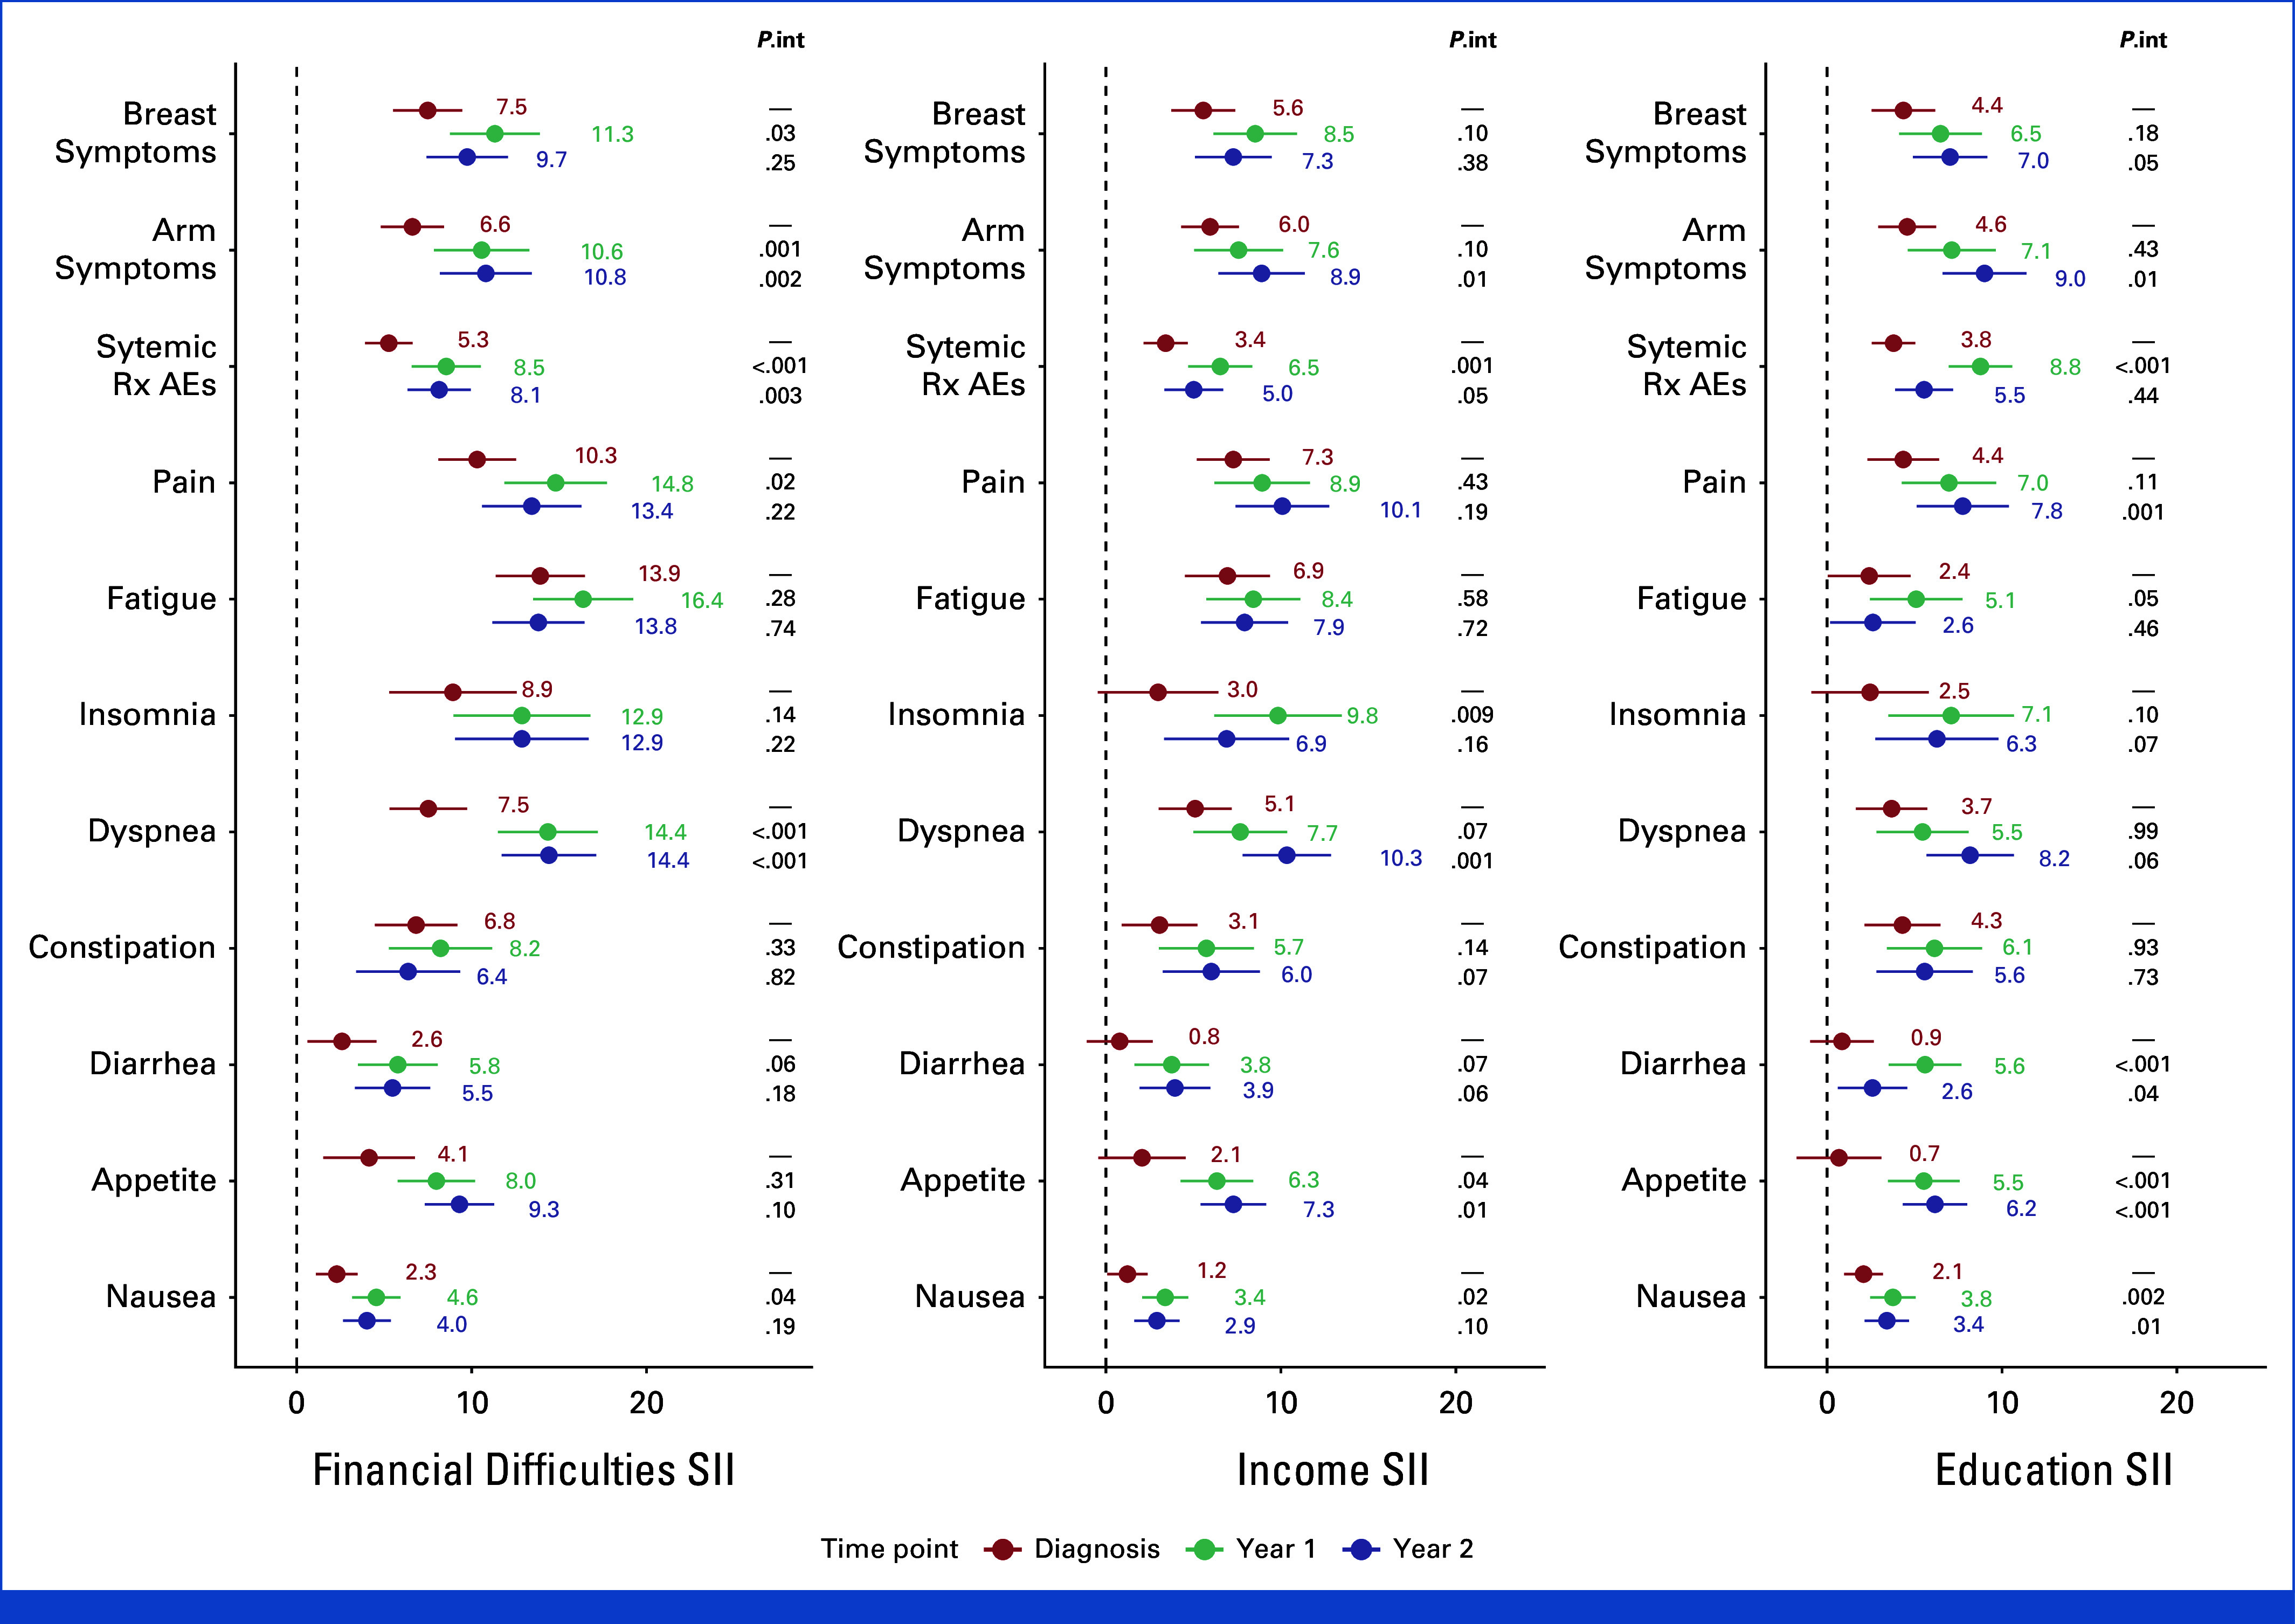
FIG A2.

Inequalities in QLQ-C30 and QLQ-BR23 symptom scales scores for each studied time point and SES indicator. Models are adjusted for age, comorbidities, breast cancer stage at diagnosis, type of lymph node management, surgery type, type of systemic treatment, and use of radiotherapy. Reported p values are for interaction by time points (P.int). AEs, adverse events; QLQ-C30, QoL Core 30 questionnaire; Rx, treatment; SES, socioeconomic status; SII, slope index of inequality.
