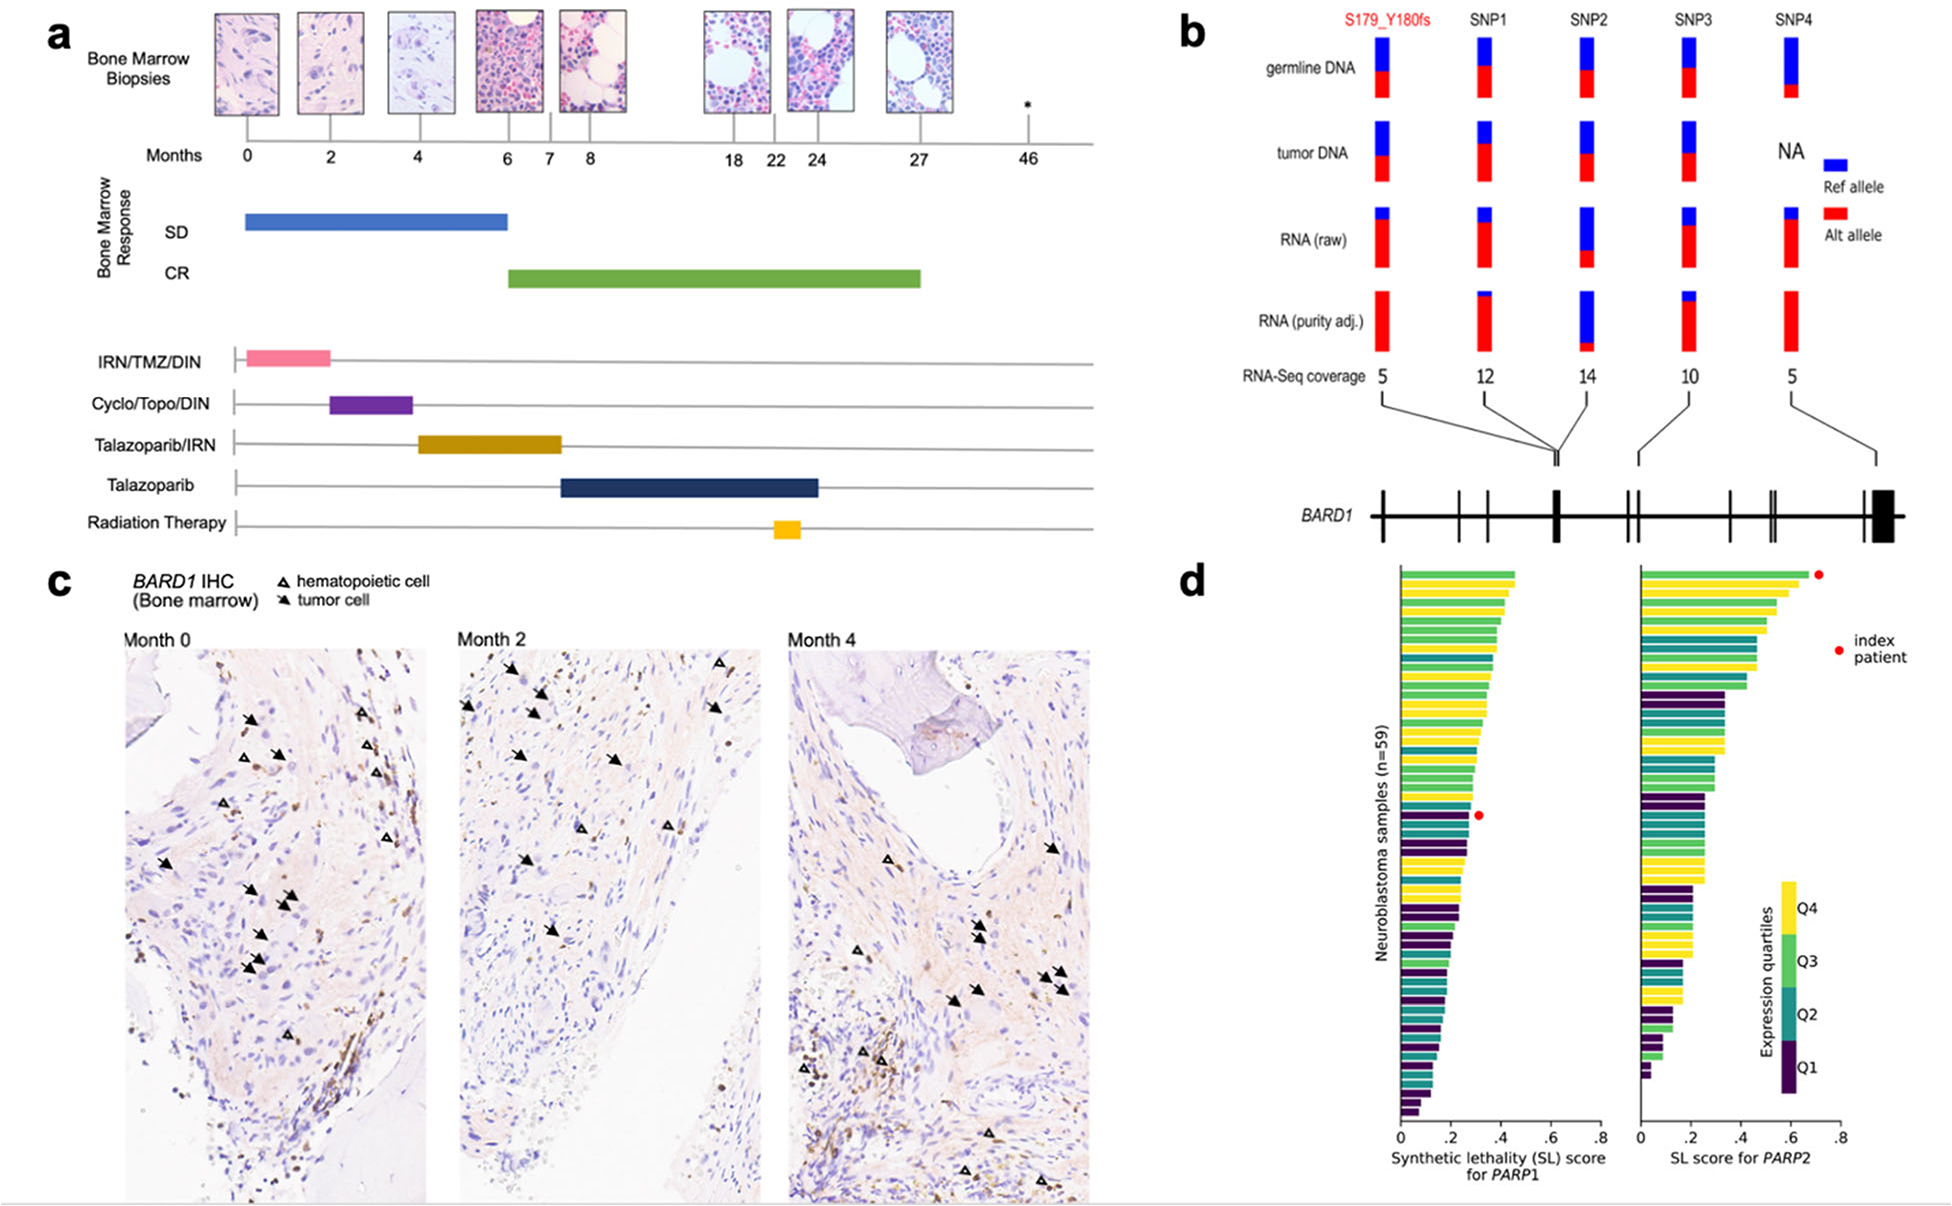
FIGURE 1. Treatment history and molecular features of a high-risk neuroblastoma patient with sustained response to PARP inhibitor (talazoparib).

a) Patient’s (patient ID SJNBL031647) bone marrow response over time in months, depicted by bone marrow biopsy histology (top row) and response per Revised INRC Criteria3 (middle rows), in correlation with treatments received over time (bottom rows), demonstrated by colored horizontal bars. Month 0 indicates the start of the patient’s treatment for progressive neuroblastoma at our institution. The patient received PARPi (talazoparib 400 mcg/m2 IV, days 1–7) between months 4 and 24 as indicated by gold and dark blue bars; *: asymptomatic, clinically well with negative FDG-PET scan; bone marrow not assessed at this time point based on clinical judgment. Abbreviations: SD: stable disease, CR: complete response, IRN: irinotecan (initially given at 40 mg/m2 IV, days 1–5; reduced to 20 mg/m2 following cycle 5 and eliminated following cycle 6), TMZ: temozolomide, DIN: dinutuximab, Cyclo: cyclophosphamide, Topo: topotecan.
b) Allele-specific expression of BARD1 in tumor RNA-seq of the index patient (SJNBL031647). In addition to the S179_Y180fs frameshift (highlighted in red), four heterozygous SNPs (labeled SNP1‒4) identified from the germline exome were used for this analysis; each site had ≥5X coverage in RNA-seq. Their variant allele fraction (VAF) values in germline DNA, tumor DNA, tumor RNA-seq and purity-adjusted tumor RNA-seq are shown in parallel, indicating allele specific expression (ASE) in tumor RNA (p-value = 0.015 based on simulation analysis, see Supplementary Appendix.). c) BARD1 protein expression in index patient’s tumor cells at months 0, 2 and 4. Immunohistochemical staining (IHC) was performed against BARD1 on the bone marrow biopsies. Arrows indicate BARD1-negative tumor cells with definite ganglion cell differentiation. Open triangles indicate BARD1-positive background hematopoietic cells. Additional BARD1-negative cells correspond to tumor Schwann cells. d) Synthetic lethality (SL) score was estimated by a pediatric cancer-based gene network model for PARP1 and PARP2 inhibition (Supplementary Appendix). The index patient (red circle) is compared with 58 other neuroblastoma patient samples. Bars are color-coded corresponding to the quartiles of expression, measured by transcript per million (TPM), for each gene.
