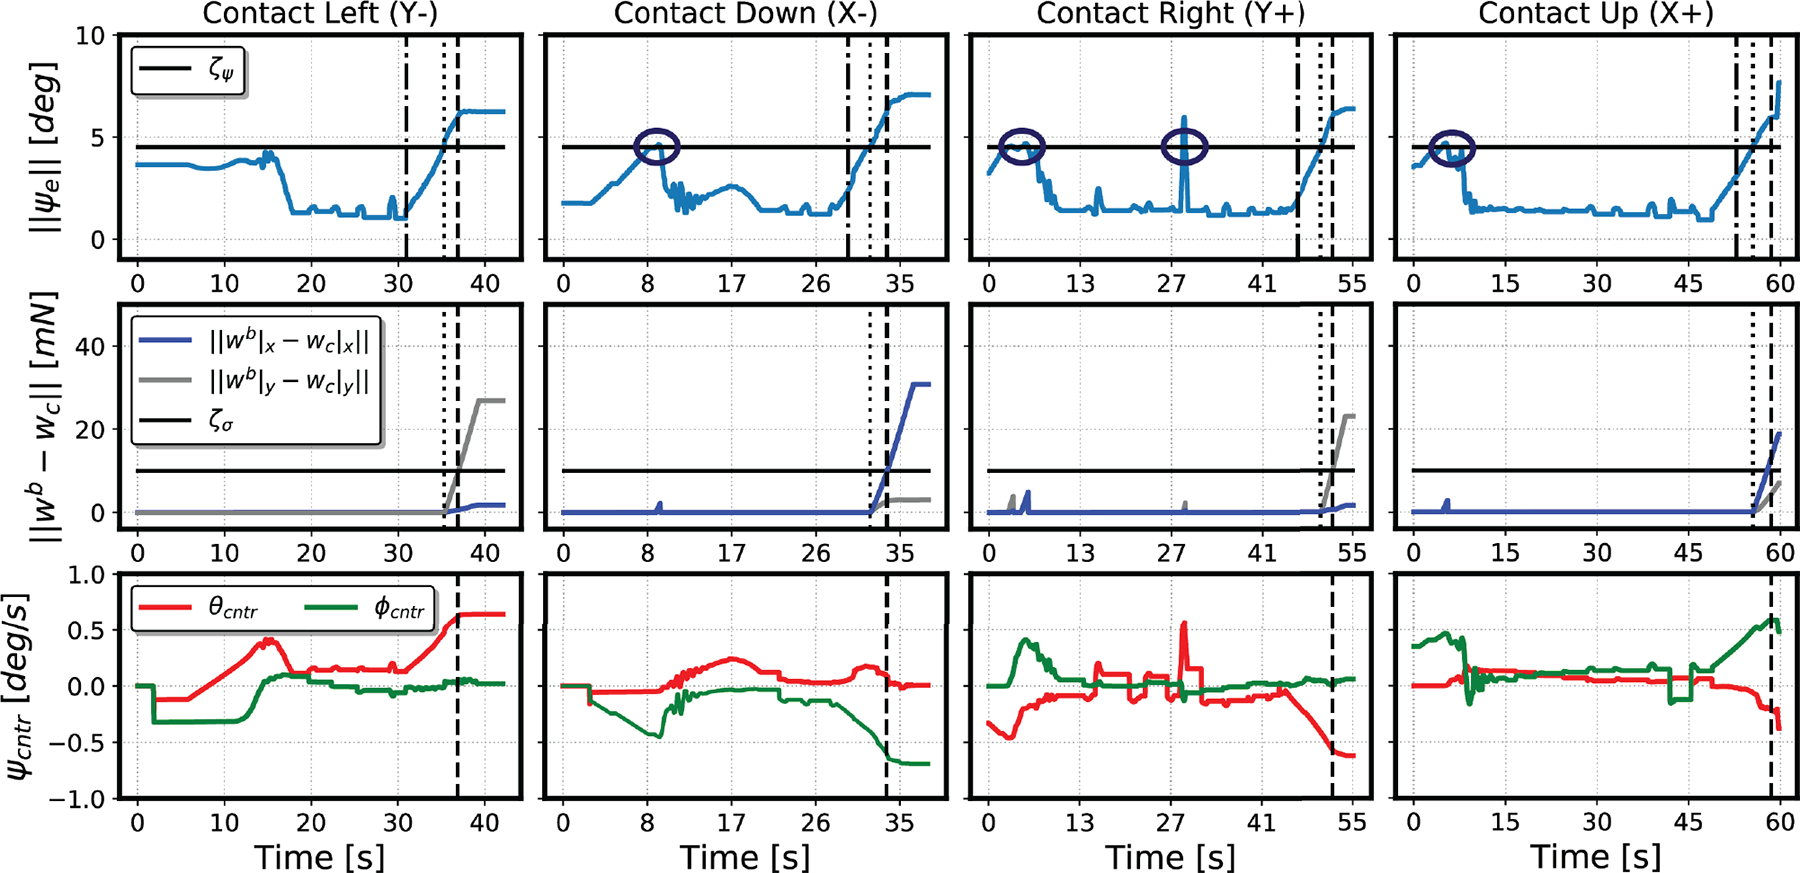
Fig. 6.

Results of contact detection trials in four directions (left, down, right, up) with respect to the camera frame. The first row shows the kinematic error measurement over time, with the horizontal line representing the threshold for possible contact. The vertical lines represent the time of visual contact, possible contact detected, and contact confirmed by the algorithm (in order from left to right). Circled locations on these plots correspond to times when transient error resulted in the algorithm identifying possible contact temporarily. The second row shows the change in force after the detection of possible contact. In each case, this measure increases in the direction of contact without bringing the error back below the possible contact threshold. The third row shows the commanded motions, which determine the direction of contact along each axis.
