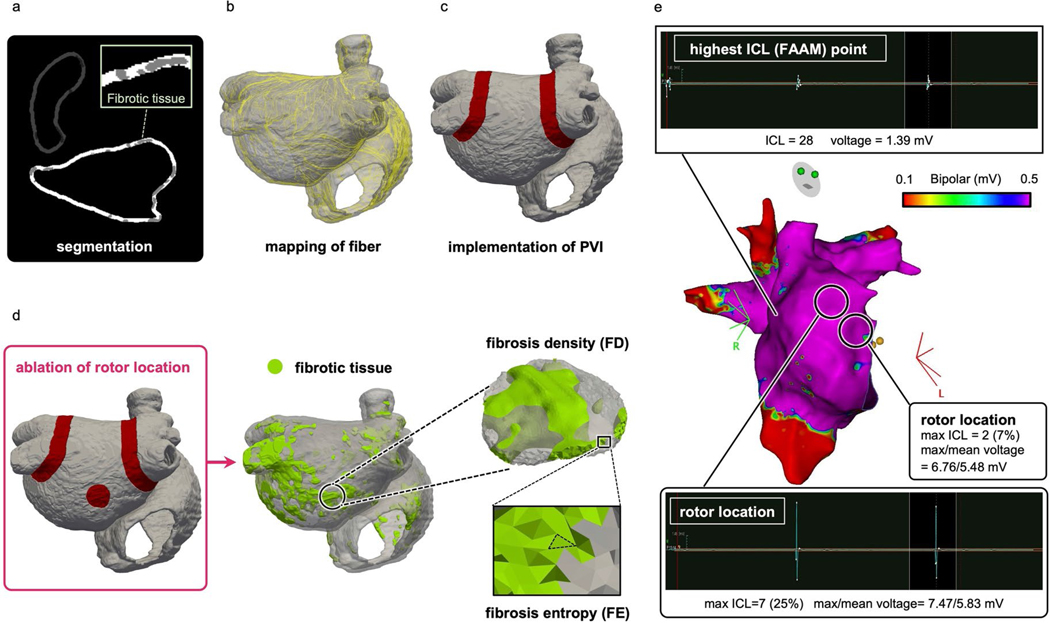
Extended Data Fig. 5 |. Personalized atrial DTs.
a: Bi-atrial segmentation of LGE-MRI images with fibrotic tissue in gray. b: Fiber mapping (yellow lines) in a DT. c: Implementation of PVI ablation lines (red). d: Calculation of FD and FE at ablated rotor locations (red circle). e: Top image: Voltage amplitude and FAAM potentials of bipolar electrograms with the highest ICL percentage recorded at the mapping point. Middle image: An EAM map created using the CARTO system. Bottom image: Voltage amplitude and FAAM potentials of bipolar electrograms at rotor locations.

